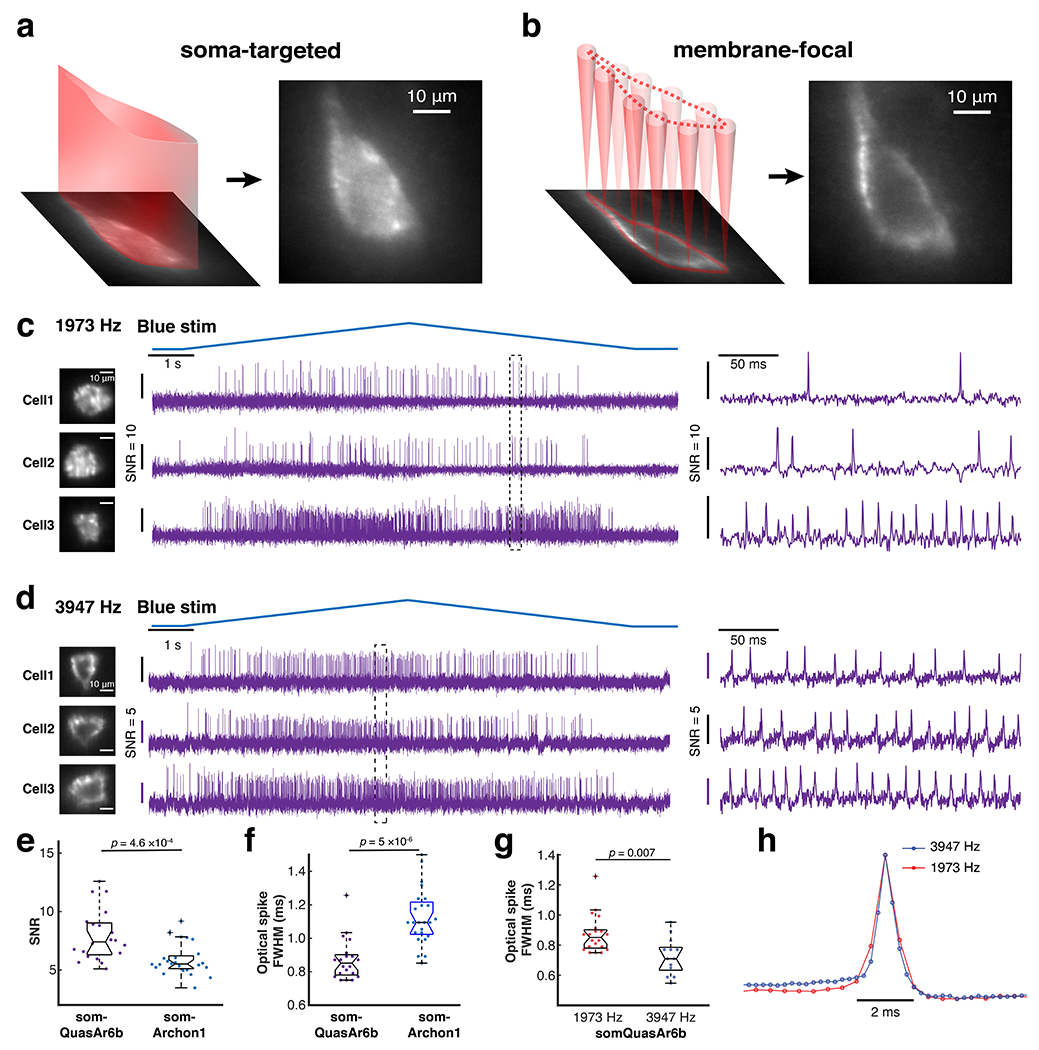
Extended Data Fig. 8. Optopatch in hippocampal PV cells (Related to Fig. 4).

a,b. Two ways of patterning 635-nm light to the cell with a spatial light modulator (SLM). Left: soma-targeted. Right: membrane-focal. The cell shown here was a hippocampal PV neuron (imaged with 25x, NA = 1.05 objective). Compared to whole-soma illumination, membrane-focal illumination provides improved shot-noise-limited SNR but greater sensitivity to motion artifacts. c, d. Representative Optopatch traces of somQuasAr6b+ PV cells, recorded at 2 kHz (1973 Hz) and 4 kHz (3947 Hz) with a 10x objective (NA 0.6). Magnified views of the boxed regions are shown on the right. For the 2 kHz-imaging experiment, soma-targeted illumination was used. For the 4 kHz-imaging experiment, membrane-focal illumination was used. Due to this difference in the optical configuration, the SNRs from these two datasets were not compared in the analysis. e. Comparison of the in vivo SNR of QuasAr6b (n = 20 cells, 3 animals) and Archon1 in PV cells (n = 24 cells, 2 animals), two-sided Wilcoxon rank-sum test. f. Comparison of optical spike full-width at half-maximum (FWHM) of optogenetically triggered spikes in PV cells, imaged with somQuasAr6b and somArchon1 at a 2 kHz frame rate, two-sided Wilcoxon rank-sum test. g. Comparison of optical spike FWHM of optogenetically triggered spikes in PV cells, imaged with somQuasAr6b a 2 kHz (n = 20 cells, 3 animals) and 4 kHz (n = 13 cells, 2 animals) frame rate, two-sided Wilcoxon rank-sum test. h. Spike-triggered average fluorescence waveform of optogenetically trigged spikes recorded with somQuasAr6b a 2 kHz (n = 20 cells, 3 animals) and 4 kHz (n = 13 cells, 2 animals) frame rate.
