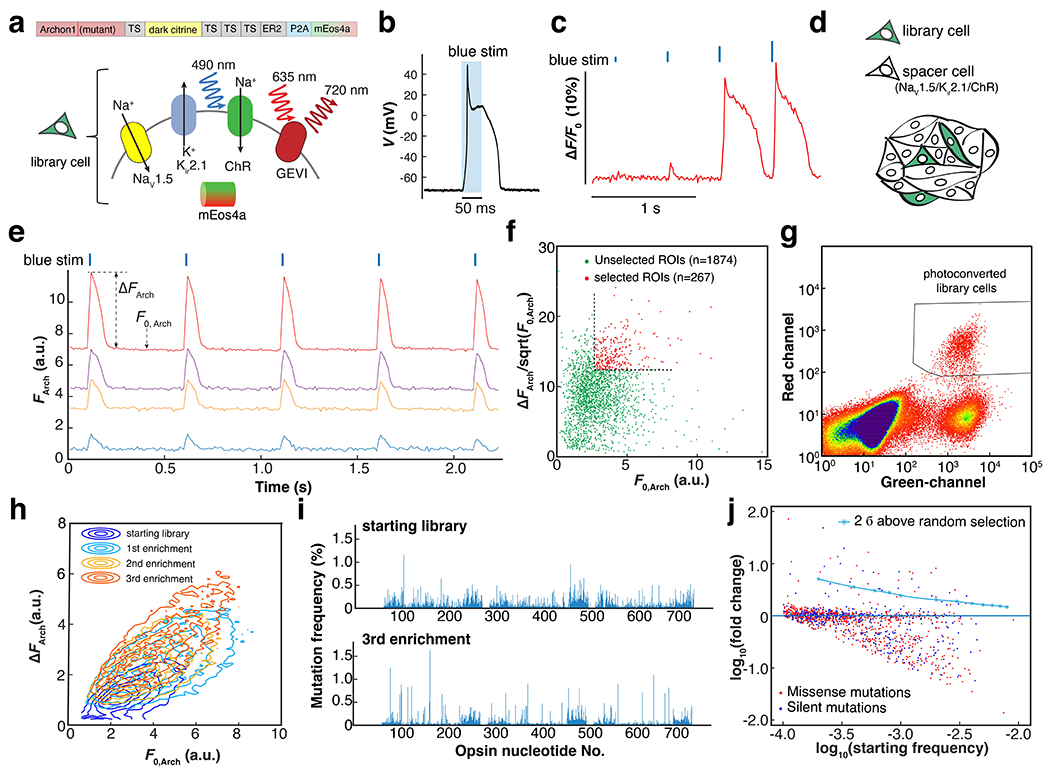
Figure 2. Directed evolution of an archaerhodopsin-derived genetically encoded voltage indicator.

a. Genetic composition of the library cells. Spiking HEK cells containing a candidate GEVI mutant, channelrhodopsin actuator, mEos4a phototag, and NaV1.5 and Kir2.1 to imbue electrical excitability. Here TS is the Trafficking Sequence from Kir2.162, ER2 is the endoplasmic reticulum export motif from Kir2.0 63, 64, and P2A is a self-cleaving peptide. B. Optogenetically triggered spike of the spiking HEK cell, recorded via whole-cell patch clamp (exc. At 488 nm, 4.4 mW/mm2, see also Extended Data Fig. 2a). c. Threshold response of spiking HEK cells to 10-ms increasing optogenetic stimulus strengths, visualized with the voltage-sensitive dye BeRST1 (exc. 635 nm). D. Sample preparation for pooled screening. Library cells were mixed with electrically excitable but non-fluorescent and optically inert spacer cells in approximately a 1:10 ratio. E. Examples of fluorescence traces extracted from individual sources in a pooled library screen (Arch fluorescence channel). Precisely timed spikes were evoked by blue light stimulation (blue ticks, exc. 490 nm, 10 ms). ΔFArch is calculated as the average baseline-to-peak difference in Arch-channel fluorescence and F0, Arch is the average baseline fluorescence. For the details of image segmentation, see Extended Data Fig. 3c. f. Scatter plot of vs. F0, Arch for all the automatically segmented ROIs in a 2.3-mm × 2.3-mm FOV. The quantity was used as a measure of shot-noise-limited SNR. Selection threshold: 50th percentile for F0, Arch; 75th percentile for . g. Representative FACS data showing three distinct populations: photoconverted library cells; unselected library cells; spacer cells (Green channel: exc. 488 nm; Red channel: exc. 561 nm). h. Three rounds of iterative enrichment shifted the population phenotype. i. Manhattan plot showing the mutation frequency at each nucleotide in starting and post-screening libraries. j. Logarithmic plot of the starting mutation frequency vs. the fold of change. In this library, there were 970 missense mutations and 405 silent mutations.
