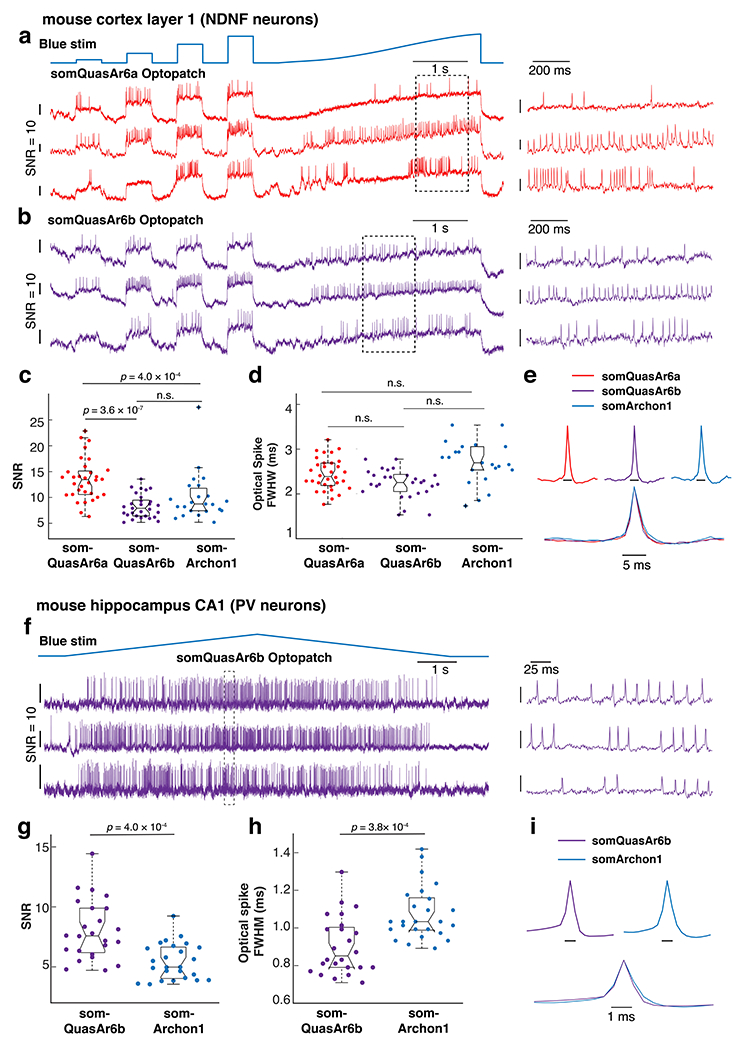
Figure 4. Characterization of somQuasAr6a- and somQuasAr6b-based Optopatch in vivo.

Recordings were performed with a 25x objective (NA = 1.05). a, b. Simultaneous optogenetic stimulation and voltage imaging (996 Hz) in L1 NDNF cells (visual cortex) expressing somQuasAr6a- or somQuasAr6b-based Optopatch in anesthetized mice. Magnified view of the boxed regions is shown on the right. c. Comparison of in vivo SNR of somQuasAr6a (n = 32 cells, 2 animals), somQuasAr6b (n = 29 cells, 2 animals), and somArchon1 (n = 23 cells, 2 animals) in NDNF cells. n.s. not significant, two-sided Wilcoxon rank-sum test. d. Comparison of optical spike full-width at half-maximum (FWHM) of optogenetically triggered spikes in NDNF cells, imaged with somQuasAr6a (n = 32 cells, 2 animals), somQuasAr6b (n = 29 cells, 2 animals), and somArchon1 (n = 23 cells, 2 animals) at a 1 kHz frame rate. n.s., not significant, two-sided Wilcoxon rank-sum test. e. Spike-triggered average fluorescence waveforms of the optogenetically triggered spikes in NDNF cells measured by somQuasAr6a, somQuasAr6b, and somArchon1. f. Double-ramp Optopatch measurements in hippocampal PV cells (voltage imaging at 1973 Hz) in anesthetized mice. Magnified view of the boxed regions is shown on the right. g. Comparison of the in vivo SNR of QuasAr6b (n = 24 cells, 3 animals) and Archon1 in PV cells (n = 25 cells, 2 animals), two-sided Wilcoxon rank-sum test. h. Comparison of optical spike full-width at half-maximum (FWHM) of optogenetically triggered spikes in PV cells, imaged with somQuasAr6b and somArchon1 at a 2 kHz frame rate, two-sided Wilcoxon rank-sum test. i. Spike-triggered average fluorescence waveforms of the optogenetically triggered spikes in PV cells measured by somQuasAr6b, and somArchon1. Box plots: central mark indicates median, bottom edge 25th percentile, top edge 75th percentile, whiskers most extreme data points excluding outliers, ‘+’ symbol outliers.
