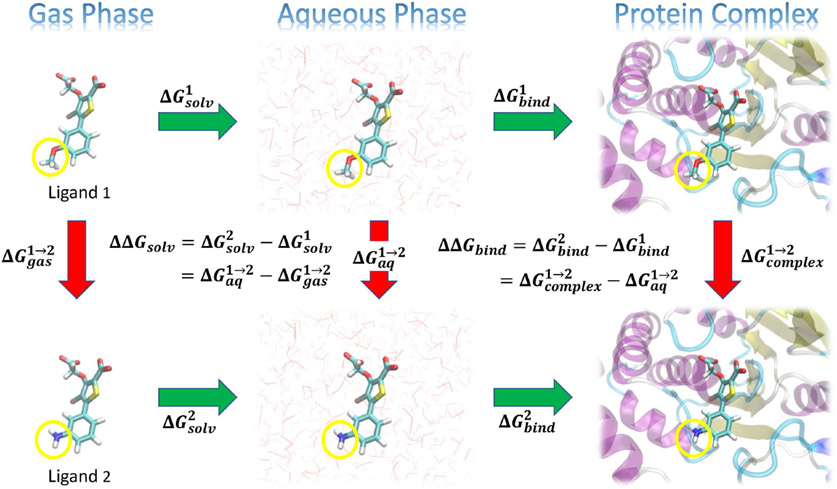
Figure 1:
Illustration of a thermodynamic cycle for a relative solvation free energy, RSFE (ΔΔGsolv) and relative binding free energy, RBFE (ΔΔGbind) for two ligands (“Ligand 1” and “Ligand 2”). The green arrows represent the absolute solvation free energy, ASFE (ΔGsolv) and absolute binding free energy, ABFE (ΔGbind) of each ligand (indicated by superscripts) that involve changing their environment from gas to aqueous phase, or from unbound in the aqueous phase to bound in a complex with the protein target, respectively. These quantities are experimentally measurable, but are challenging to directly compute as the change in the environment can be considerably complicated. The red arrows represent alchemical transformations where Ligand 1 is mutated into a similar Ligand 2 in a fixed environment. These transformations are frequently more amenable to practical computations. The yellow circles in the figures indicate the region of each ligand that undergoes the most significant changes in the alchemical transformation, and would likely be modeled using a so-called “softcore potential” during the transformation.

