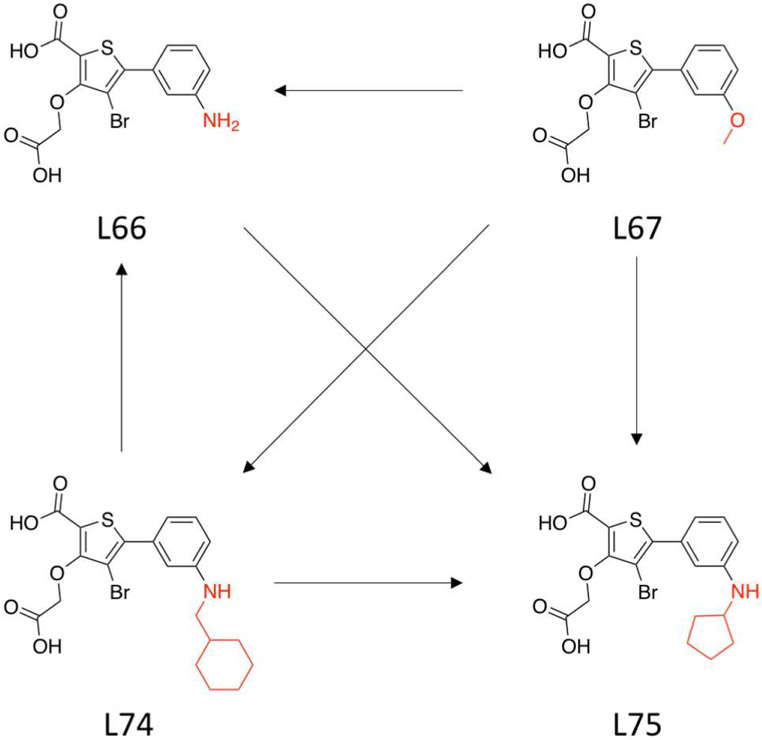
Figure 7:
Illustration of a thermodynamic graph which involves 4 ligands (L66, L67, L74, and L75) that target the PTP1B.65,66 The thermodynamic graph is constructed that involves all 6 possible alchemical transformation between ligands. The red-colored atoms shown are the defined softcore regions chosen in accord with the MCS-Enw atom-mapping algorithm described in the Methods section.

