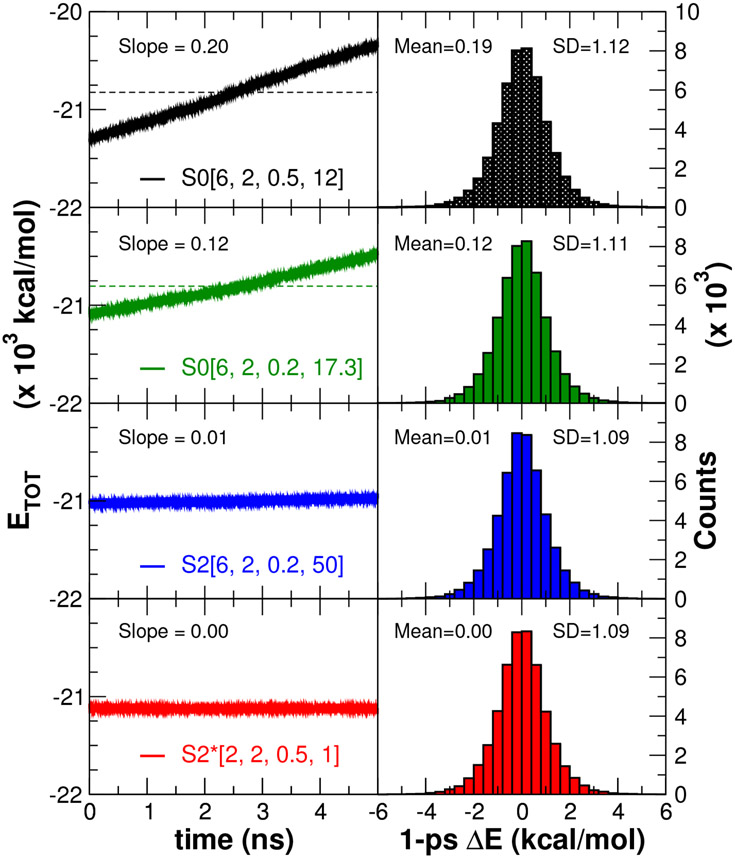
Figure 9:
The potential energy drift in the relative hydration free energy calculations for Mg2+ → Ca2+ with single precision model (SPFP) and the NVE ensemble at λ = 0.5 for the alchemical transformation pathways/softcore potentials summarized in Table 3. The left column shows the time evolution of the total energy (dashed line indicates the average value in 103 kcal/mol, and slope is in kcal/mol/ps), whereas the right column shows the 1-ps energy drift histograms with mean values and standard deviations in kcal/mol.

