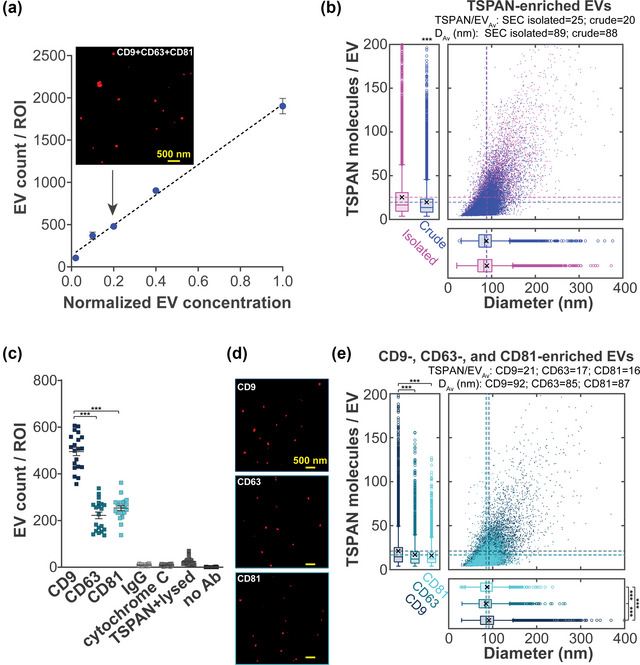
FIGURE 4.

SEVEN for characterization of EVs from crude pooled human plasma. (a) Number of detected TSPAN‐enriched EVs per ROI. The x‐axis represents EV concentrations normalized to the highest applied EV concentration (1:20 dilution of crude plasma). Mean ± SEM; n = 3, 15 ROIs; R2 = 0.9947. Inset, Raw SMLM image of TSPAN‐enriched EVs. The arrow represents the dilution at which the SMLM image was acquired. (b) 2D histograms and corresponding box plots for TSPAN‐enriched EVs from either SEC‐enriched or crude plasma samples. Each dot represents a single EV with a corresponding diameter (x‐axis) and the number of detected TSPAN molecules (y‐axis). n = 5, 25 ROIs. (c) Number of detected EVs per ROI in the CD9‐, CD63‐ and CD81‐enriched EV subpopulations and controls: anti‐rabbit IgG and anti‐cytochrome C Abs were immobilized onto surfaces; anti‐TSPAN Abs were immobilized onto surfaces and EVs were lysed with Triton X‐100; surfaces were not immobilized with Abs. Mean ± SEM; n = 4, 20 ROIs. (d) Raw SMLM images of CD9‐, CD63‐ and CD81‐enriched EVs. (e) 2D histograms and corresponding box plots for CD9‐, CD63‐ and CD81‐enriched EVs isolated directly from crude plasma. Each dot represents a single EV with a corresponding diameter (x‐axis) and the number of detected TSPAN molecules (y‐axis). n = 4, 20 ROIs. Box plots in (b, e): interquartile range (box), median (center line), mean (cross); the hollow dots indicate EVs detected beyond 1.5‐times the interquartile range (marked by the Whisker lines under and over the box). *** Indicates p < 0.001. Numerical values and p‐values are provided in Tables S1–S3.
