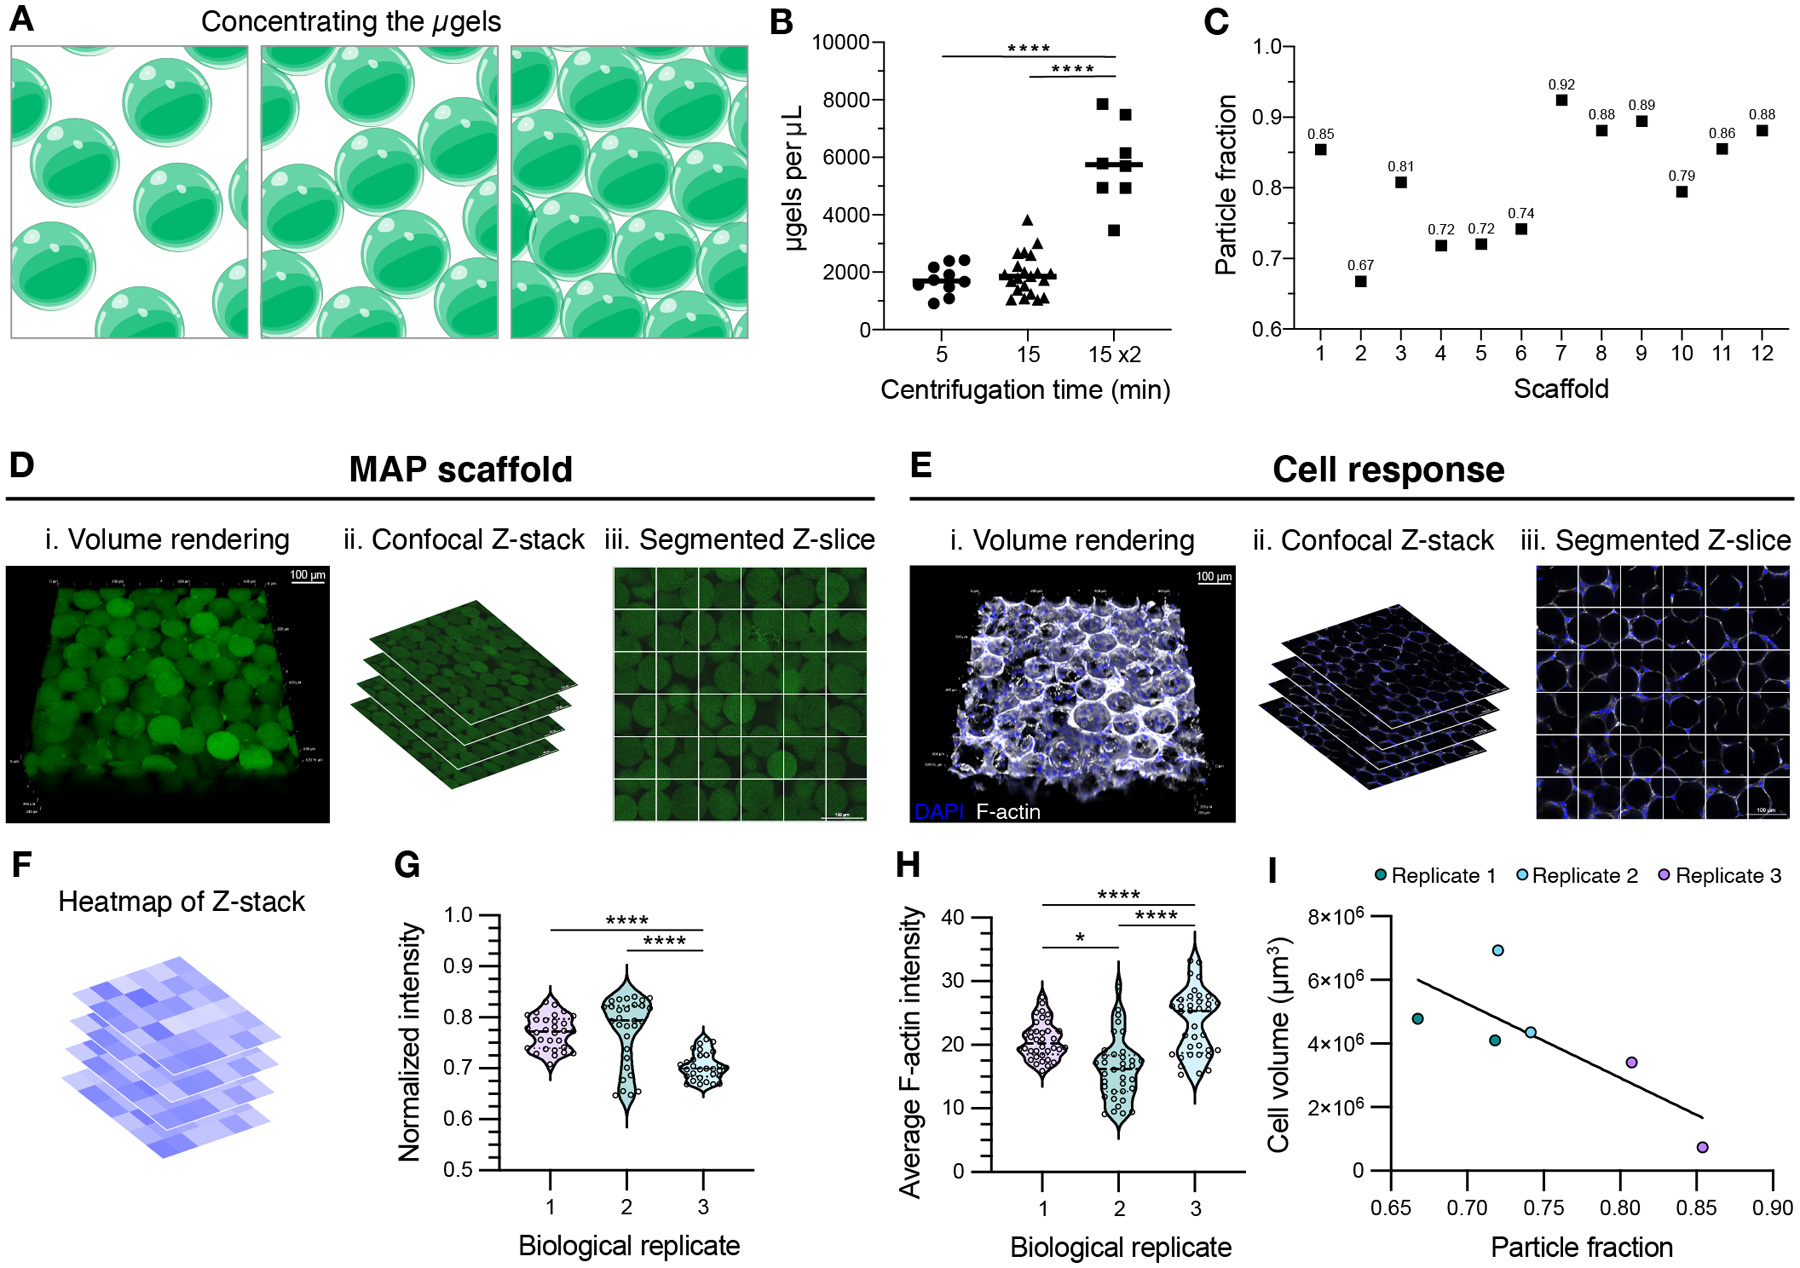
Figure 2.

(A) Schematic of microgels being concentrated from the microgel slurry during MAP scaffold preparation. (B) Concentration of microgels in the dried product when using manual buffer removal after centrifugation for 5 minutes, 15 minutes, or 15 minutes twice. A one-way ANOVA with Tukey HSD was performed on the samples dried independently (n = 8), with significance reported at p < 0.05 (*), <0.01 (**), <0.005 (***), and <0.001 (****). (C) Using centrifugation for 15 min 2x, the resultant MAP scaffolds boast a range of particle fractions. (D) MAP scaffolds prepared after centrifuging microgels for 15 minutes twice are shown as (i) volume renderings taken from (ii) confocal Z-stacks. (iii) The individual Z-slices from the Z-stacks are segmented to quantify the average intensity of the MAP scaffold channel within each square (scale bar = 100 μm). (E) D1 mouse mesenchymal cells were seeded in MAP scaffolds prepared after centrifuging microgels for 15 minutes twice and are shown as (i) volume renderings taken from (ii) confocal Z-stacks. (iii) The individual Z-slices from the Z-stacks are segmented to quantify the average intensity of the F-actin channel within each square (scale bar = 100 μm). (F) Heatmaps were generated for each Z-slice within the Z-stacks. (G) For MAP scaffolds, the average intensity across the Z-slices is plotted for one sample from each biological replicate. A one-way ANOVA with Tukey HSD was performed on the replicates, with significance reported at p < 0.05 (*), <0.01 (**), <0.005 (***), and <0.001 (****). (H) For cell response within these scaffolds, the average F-actin intensity across the Z-slices is plotted for one sample from each biological replicate. A one-way ANOVA with Tukey HSD was performed on the replicates, with significance reported at p < 0.05 (*), <0.01 (**), <0.005 (***), and <0.001 (****). (I) Cell volume was determined by IMARIS rendering of the F-actin channel from the confocal Z-stack. Cell volume results were plotted across the corresponding particle fraction from the sample.
