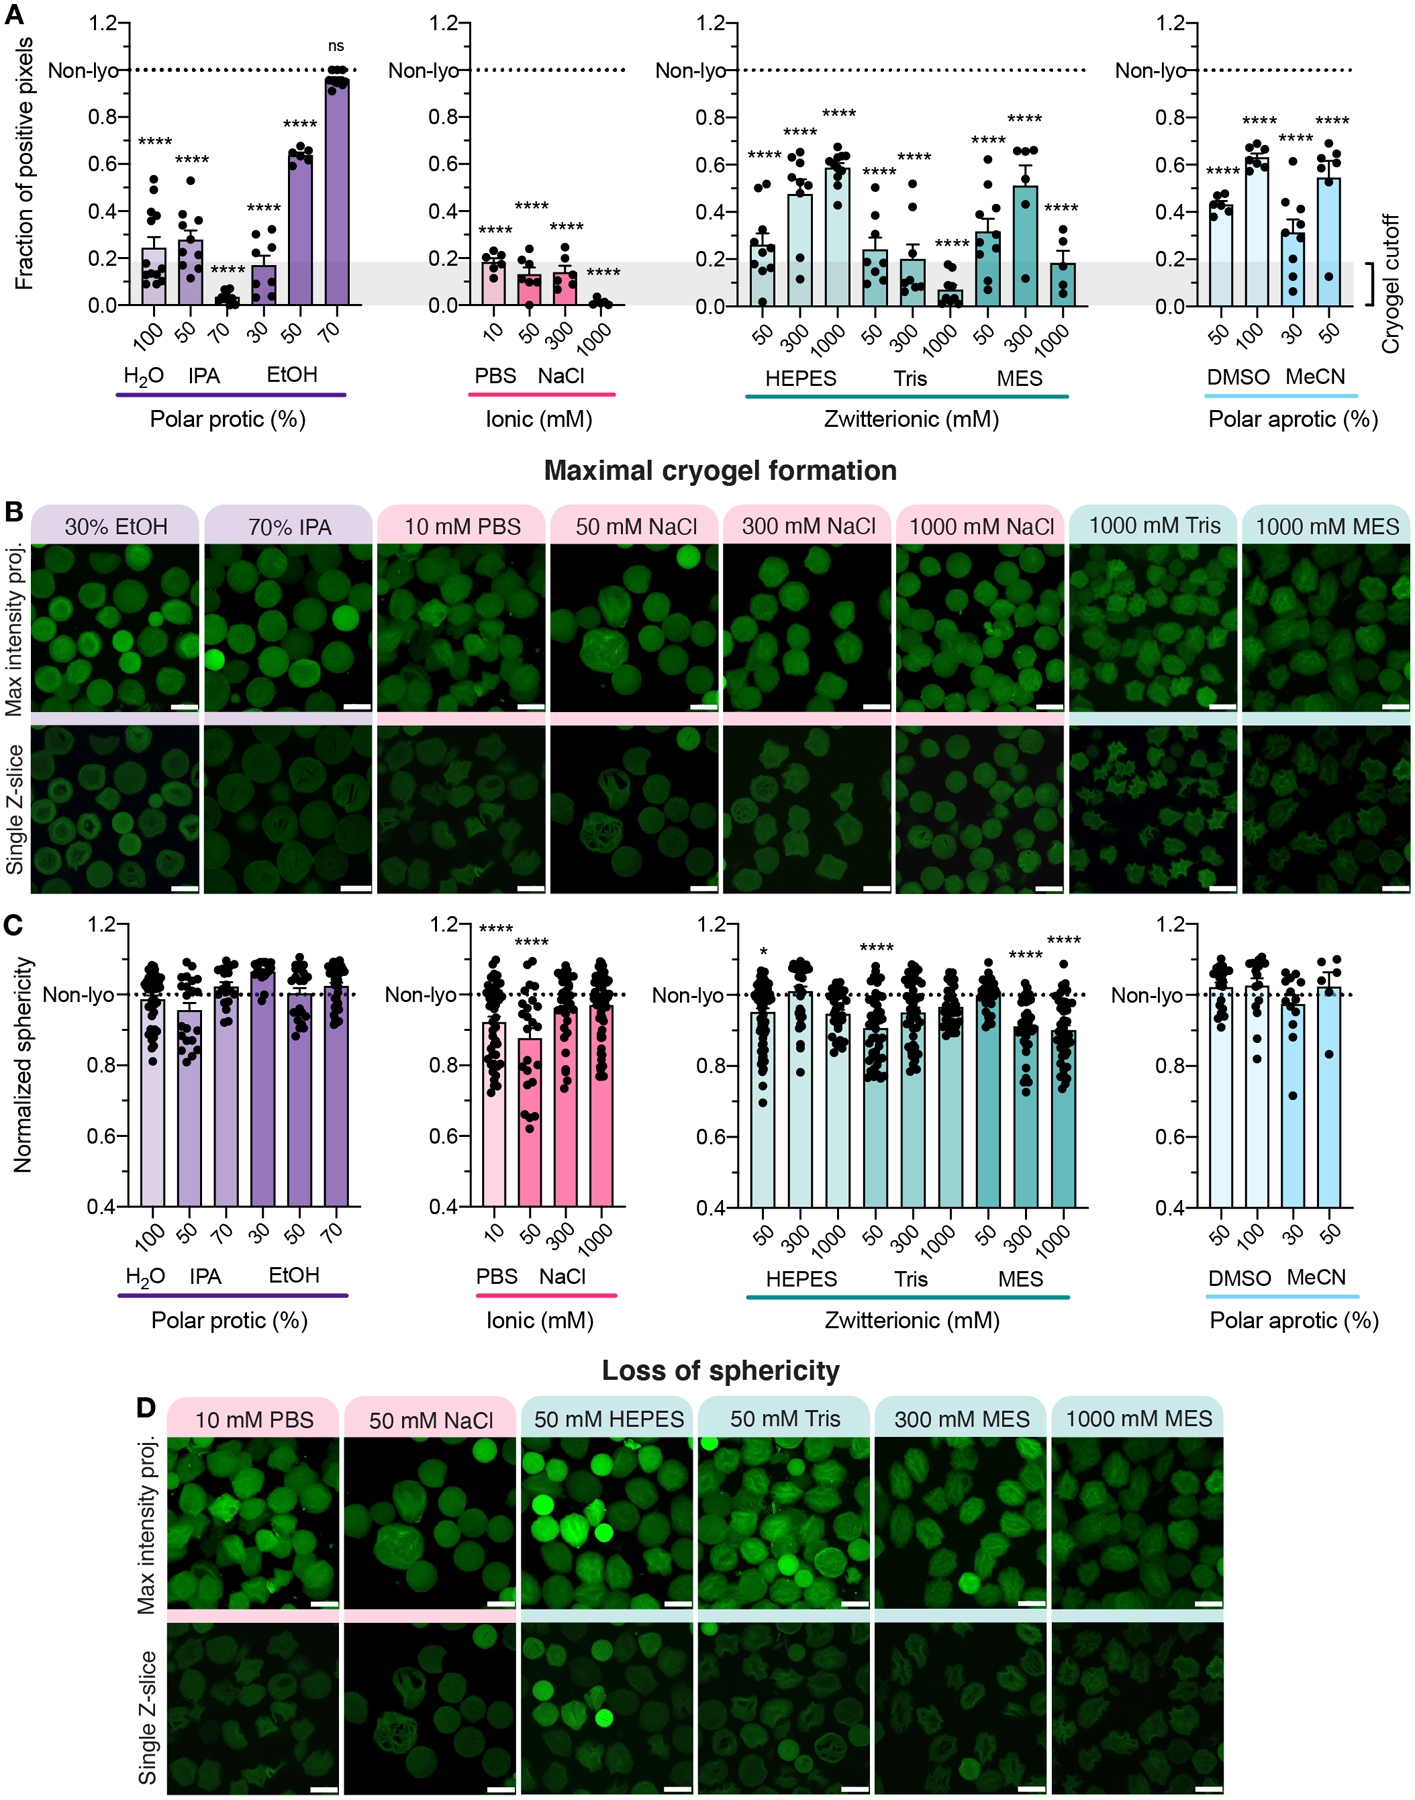
Figure 4.

(A) The fraction of pixels positive for fluorescence plotted for each condition separated by polar protic, ionic, zwitterionic, or polar aprotic medium compared to the non-lyo condition represented by the dotted line. A one-way ANOVA with Tukey HSD was performed on the samples comparing condition mean to non-lyo mean (n > 3), with significance reported at p < 0.05 (*), <0.01 (**), <0.005 (***), and <0.001 (****). (B) Representative maximum intensity projections and single Z-slices from the original Z-stack for eight lyophilization conditions with less than 20% positive pixels as indicated by the gray box in panel A (scale bar = 100 μm). (C) 3D volume renderings of confocal Z-stacks were made using IMARIS software and analyzed for sphericity. A one-way ANOVA with Tukey HSD was performed on the samples comparing condition mean to non-lyo mean (n > 3), with significance reported at p < 0.05 (*), <0.01 (**), <0.005 (***), and <0.001 (****). (D) The medium conditions that significantly varied from non- lyo sphericity are shown as representative maximum intensity projections and single Z-slices from the original Z-stack (scale bar = 100 μm).
