Figure 5.

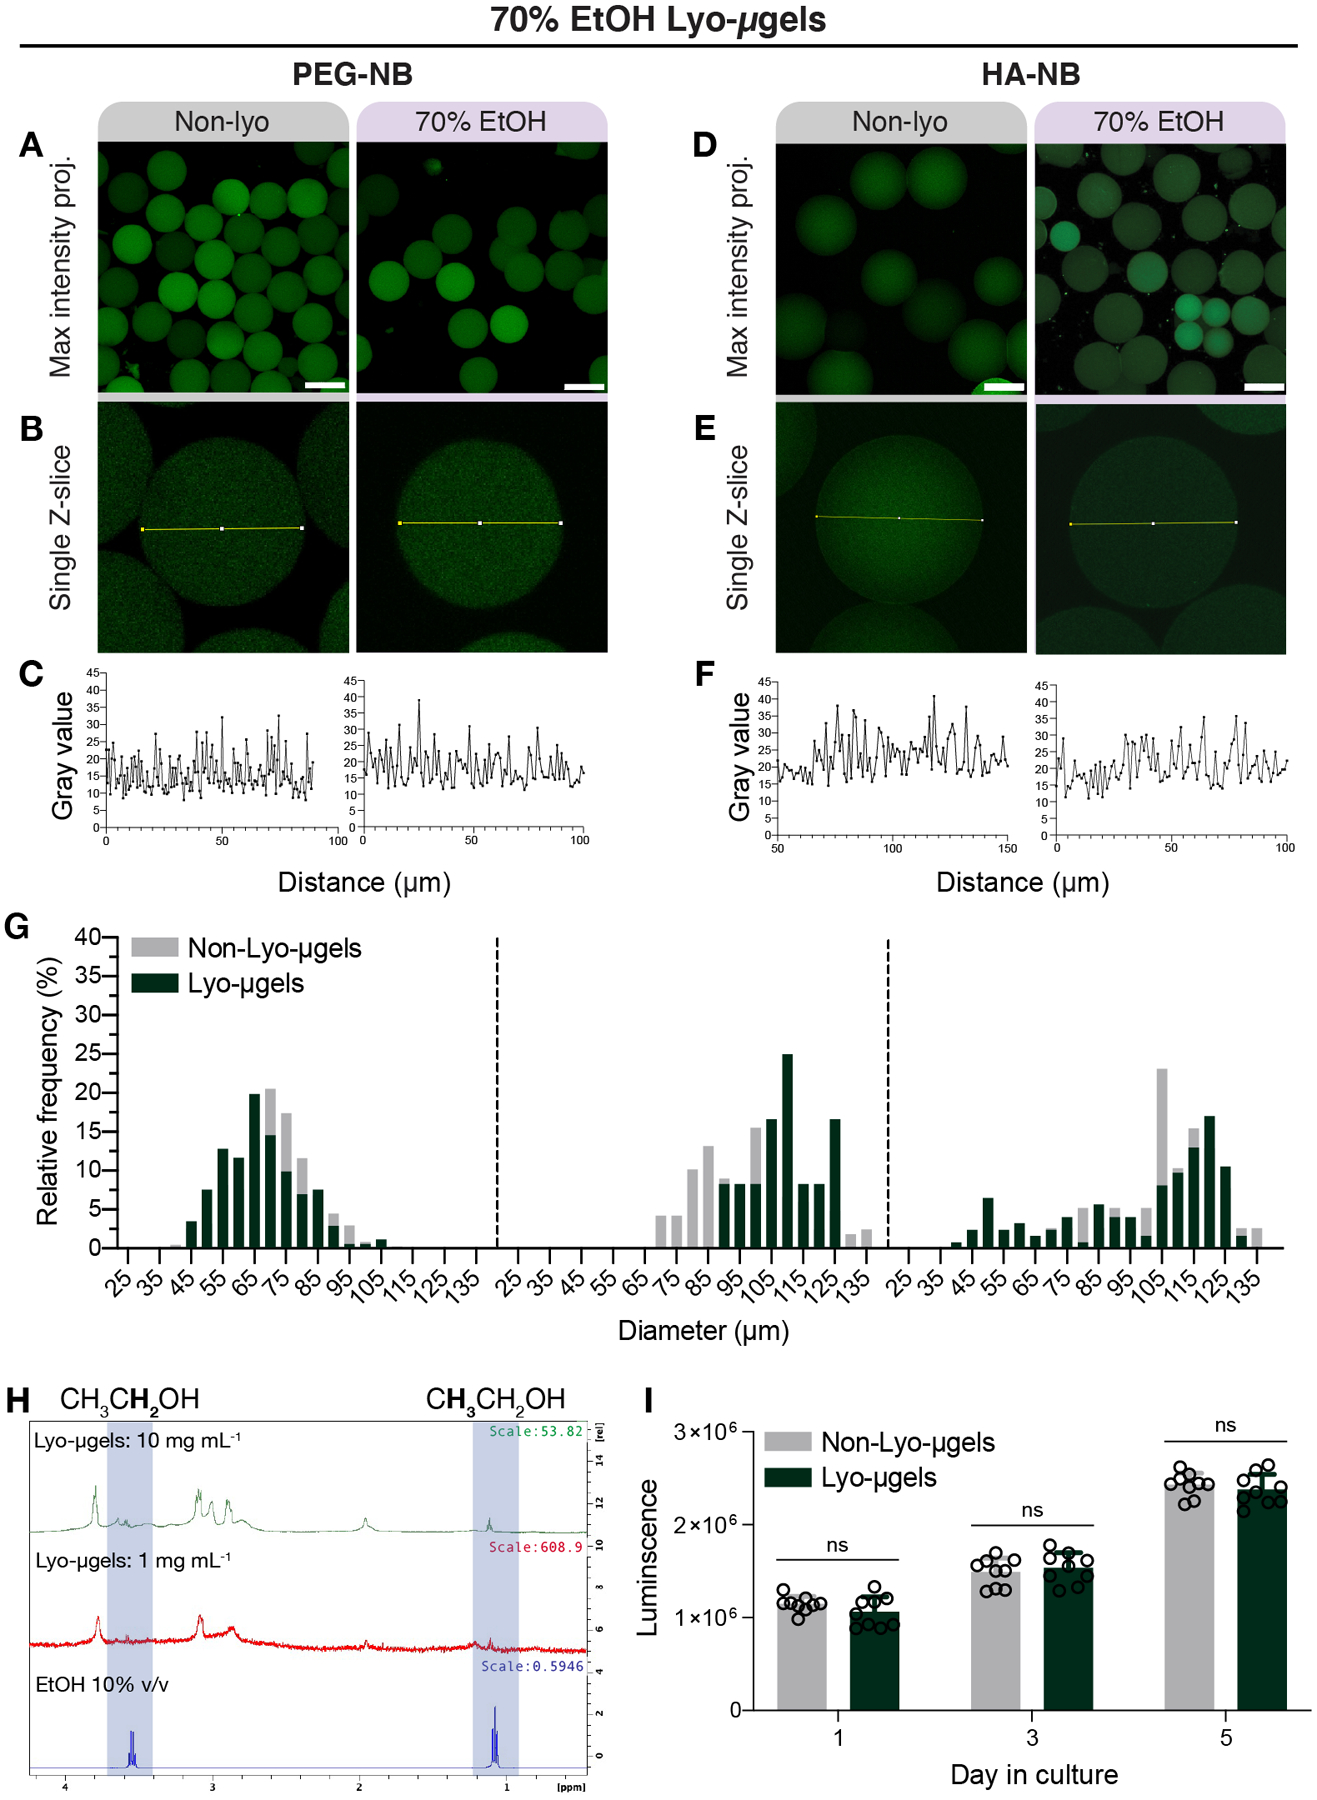
Microgels composed of either PEG or HA can be lyophilized with 70% EtOH and rehydrated. PEG-NB microgels before (Non-lyo) and after lyophilization with 70% EtOH are shown as a maximum intensity projections (A) and (B) single Z-slices within the confocal Z-stack (scale bar = 100 μm). The lack of pore formation within microgels is depicted by the intensity profile across bead diameter (C). HA-NB microgels before (Non-lyo) and after lyophilization with 70% EtOH are shown as a maximum intensity projections (D) and (E) single Z-slices within the confocal Z-stack (scale bar = 100 μm). The lack of pore formation within microgels is depicted by the intensity profile across bead diameter (F). Measurement of HA-NB microgel diameter before and after lyophilization (G) shown as frequency distributions across for the three separate microgel populations. (H) Proton NMR spectra of HA-NB lyo-microgels and ethanol show trace amount of ethanol peaks. (I) Luminescence values correspond to cell viability data for D1 cells cultured with non-lyo (gray) and lyo-microgels (dark green) over 5 days. A paired T-test was performed comparing conditions at each time point (n = 3 with triplicates), with significance reported at p < 0.05 (*).
