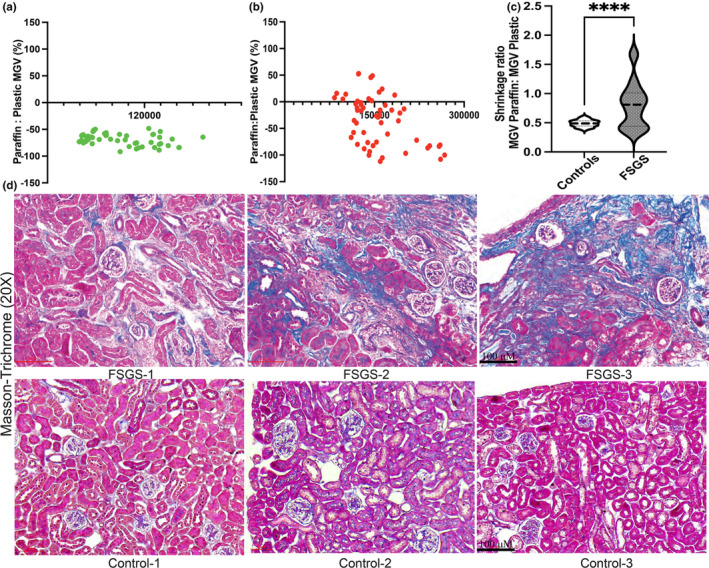
FIGURE 4.

Differential shrinkage artifact and periglomerular/glomerular fibrosis in FSGS animals. (a) Bland–Altman plots show ratios between paraffin:plastic measurements of MGV obtained in each control animal from 10 or 20 glomeruli within respective techniques [11 comparisons from 6 control animals (green dots)]. (b) shows these same ratios of MGVs obtained from 10‐glomeruli in each FSGS animal [6 comparisons from 10 FSGS mice (red dots); X‐axis shows the corresponding MGVs]. (c) Violin plot (dashed line at median) summarizes the shrinkage artifact obtained from all measurements between FSGS and control animals [mean ± SEM; ****p < 0.0001]. (d) Photomicrographs (20×) from kidney sections of representative FSGS and control animals within our dataset showing variable glomerular fibrosis (area positive for Trichrome stain) in each.
