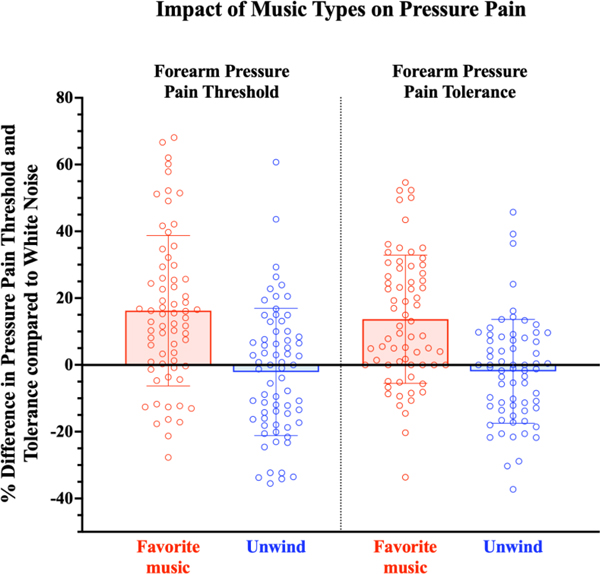
Figure 2. Percent difference in forearm pressure pain threshold (PPTh) and tolerance (PPTol) when listening to favorite music and relaxing music (Unwind) compared to white noise.
Participants reported a greater increase in PPTh and PPTol during the favorite music condition compared to white noise (PPTh mean change: 16% ± 23%; PPTol mean change: 14% ± 19%), indicating a decrease in pain sensitivity. Participants reported little change in PPTh during the Unwind condition compared to white noise (PPTh mean change: −2% ± 19%; PPTol mean change: −2% ± 16%). Percent difference in PPTh during favorite music compared to white noise was calculated using the formula ((favorite music-white noise)/white noise)*100. Percent difference in PPTh during the Unwind compared to white noise was calculated using the formula ((Unwind-white noise)/white noise)*100.

