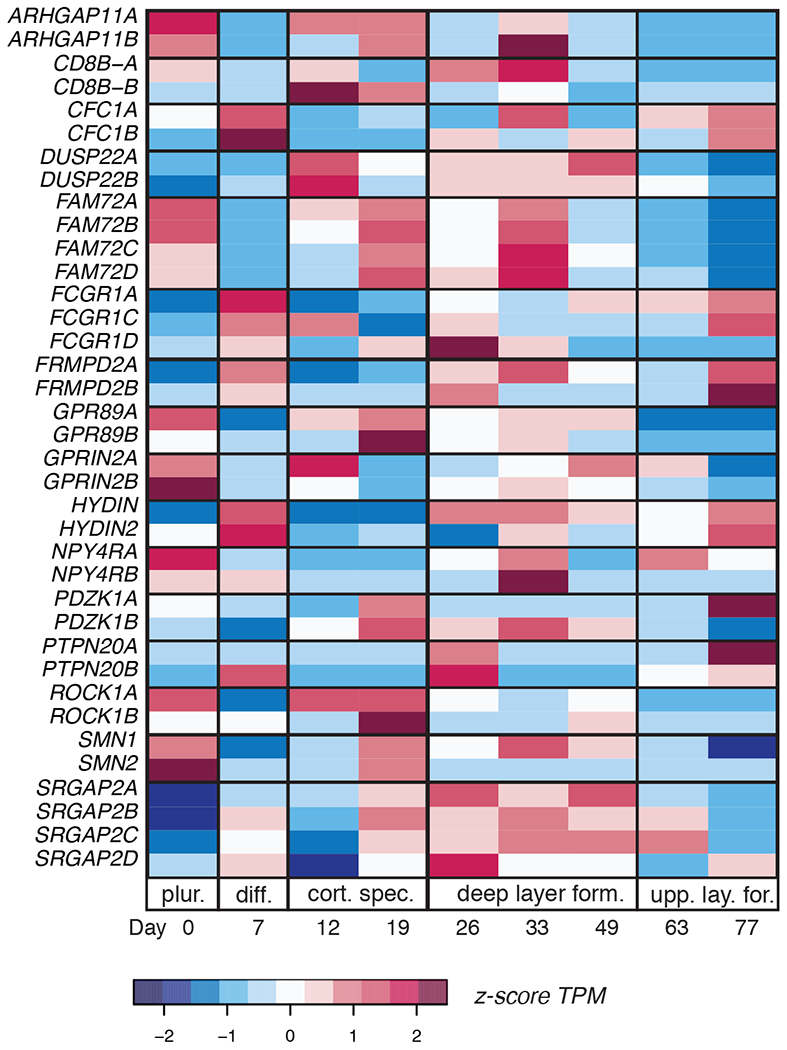
Figure 5. Transcriptional profiles of a subset HSD genes across corticogenesis using data from differentiated hESCs.

RNA-seq quantification across a time-course of 77 days to mimic developmental stages including: pluripotency (plur.), differentiation (diff.), cortical specification (cort. spec.), deep layer formation (form.) and upper layer formation (upp. lay. form.). Expression levels displayed as z-scores of HSD genes in relation to the complete transcriptome indicated as colors (red = high; blue = low expression).
