
Figure 1. Chronically-stimulated CAR T-cells exhibit type I IFN pathway upregulation.
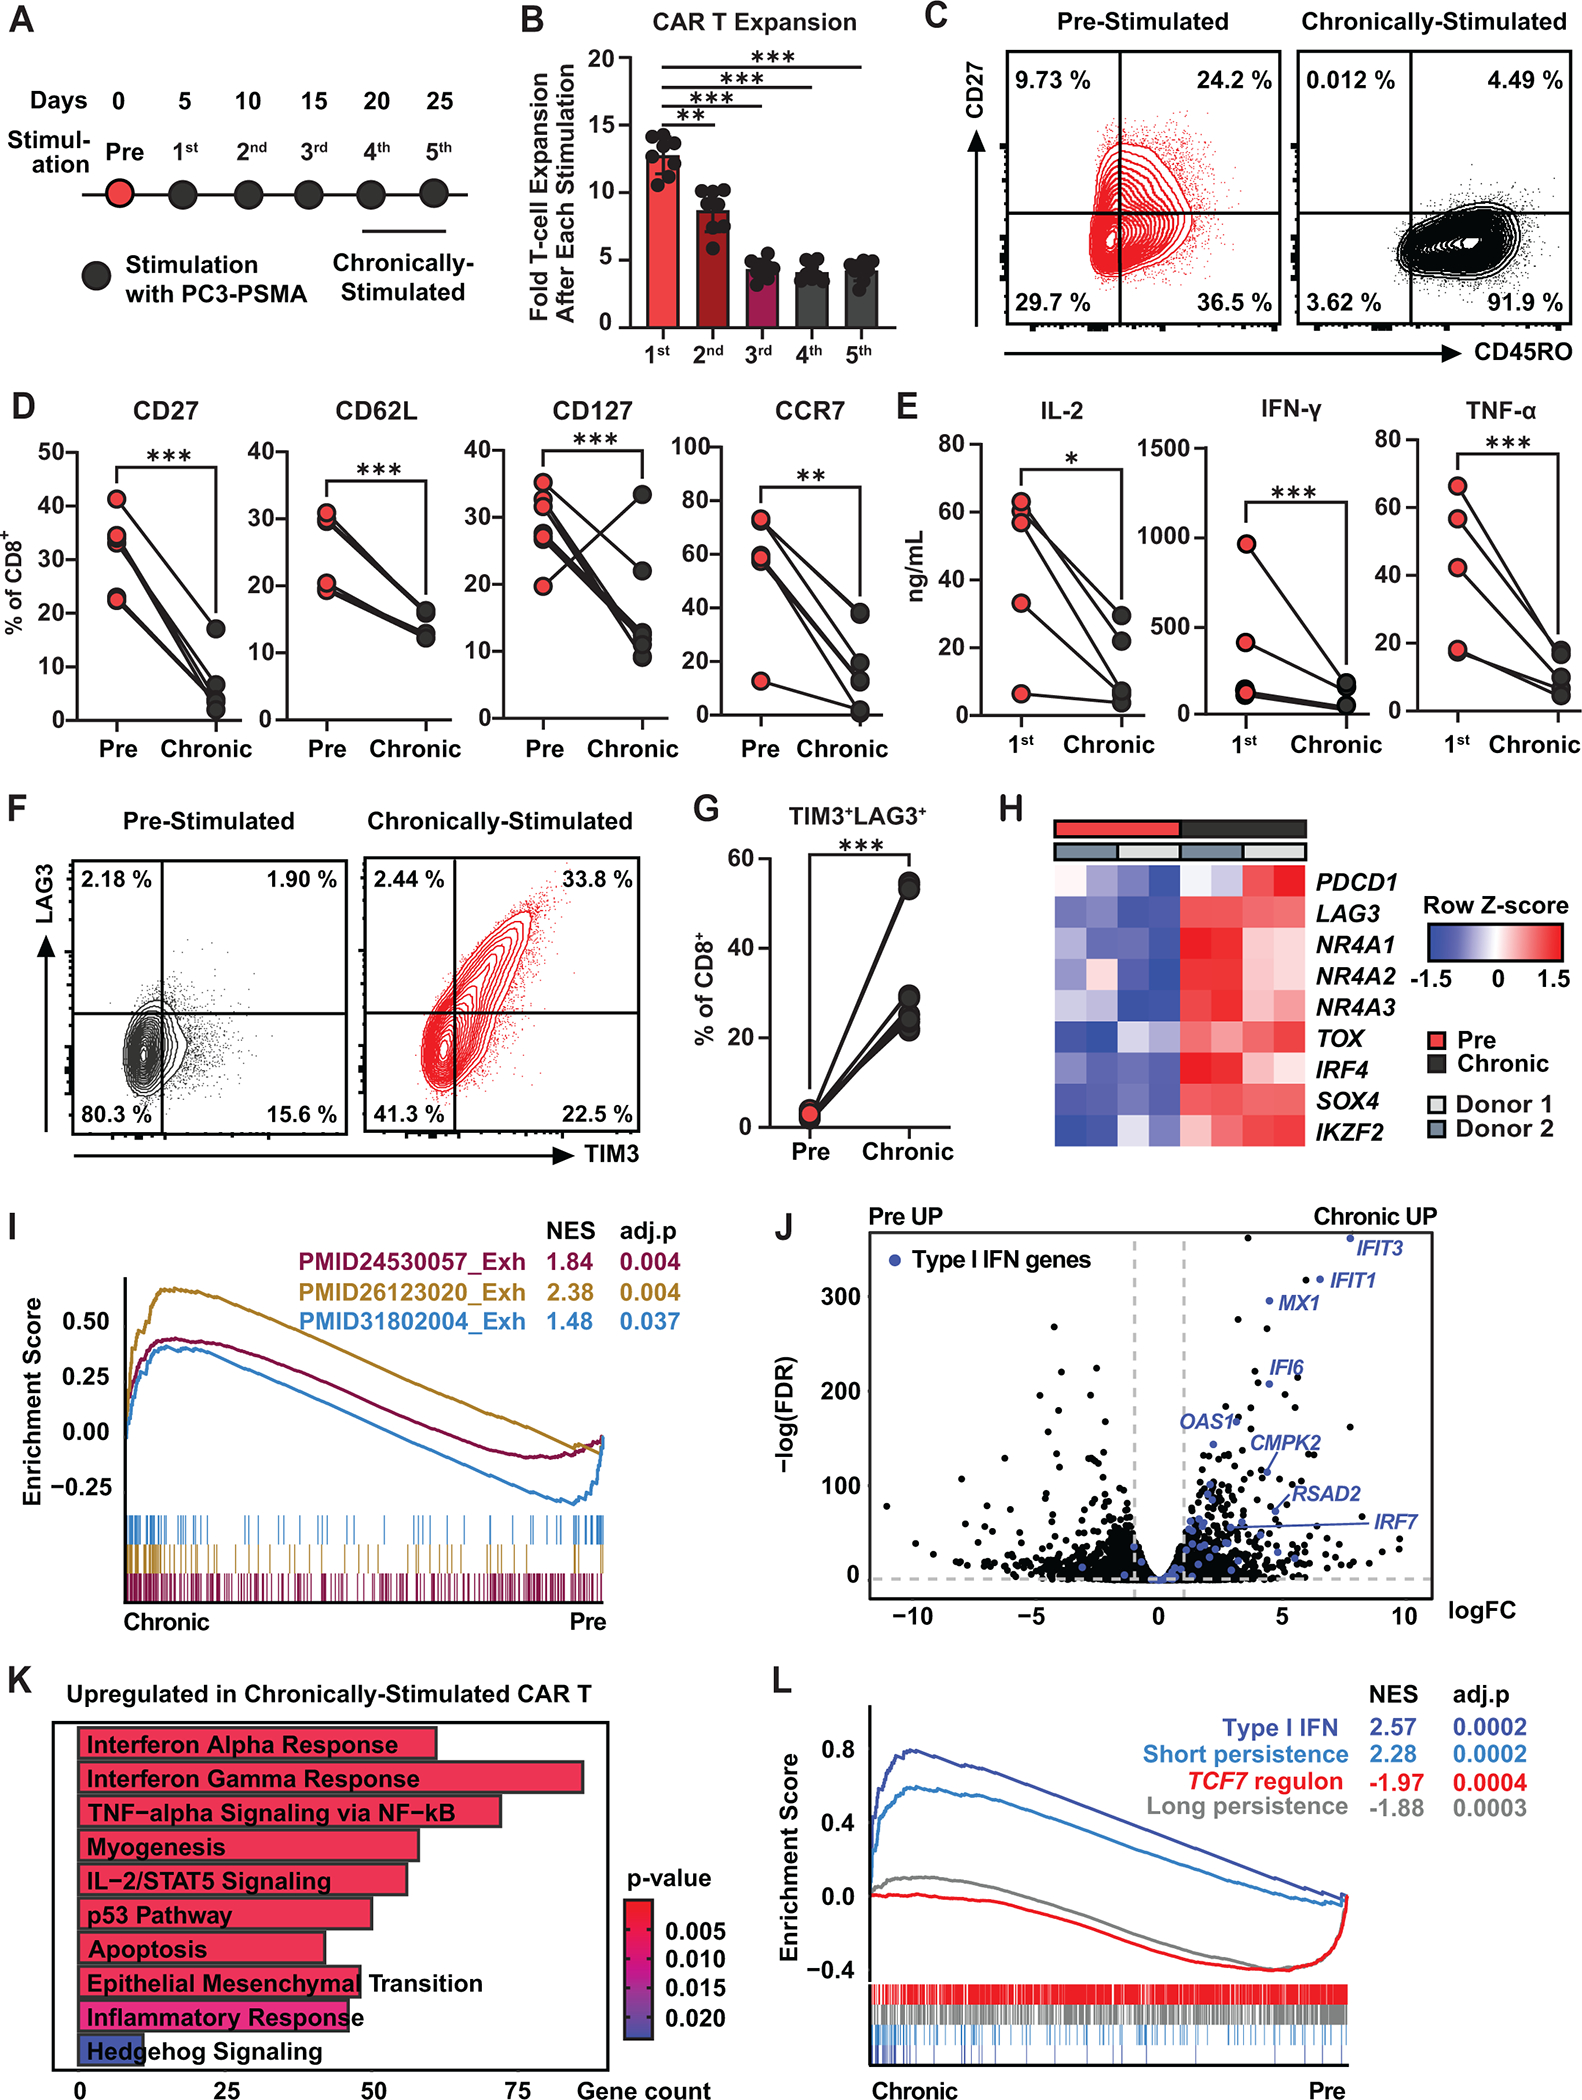
A, Schematic representation of the in vitro “stress test” used to induce CAR T-cell dysfunction. Briefly, PSMA CAR T-cells were challenged with PC3 prostate tumor cells expressing PSMA every five days at an effector to target (E:T) ratio of 3:1. B, Magnitude of CAR T-cell expansion after each antigen stimulation. Data indicate mean ± S.D. from n = 8 individual healthy donors (one-way ANOVA). C, Representative flow cytometry plots showing frequencies of CD8+ CAR T-cells expressing CD27 and CD45RO. D, Proportions of pre- and chronically stimulated CAR T-cells expressing early memory markers (CD27, CD127, and CCR7: n = 8 using four different healthy donors, CD62L: n = 6 using two healthy donors; ratio paired t-test). E, Cytokine production after the first and chronic antigen stimulation time points (n = 5 using four healthy donors; ratio paired t-test). F, Representative flow cytometry plots showing percentages of CAR T-cells expressing TIM3 and LAG3 inhibitory receptors. G, Frequency of TIM3+LAG3+ CD8 CAR T-cells. (H) Heatmap showing expression levels of exhaustion-related genes. I, Gene set enrichment analysis (GSEA) of exhaustion pathways. J, Volcano plot showing differentially expressed genes between pre- and chronically stimulated CAR T-cells. Type I IFN genes are highlighted in blue. K, Top pathways upregulated in chronically stimulated CAR T-cells. L, GSEA analysis using gene sets associated with the type I IFN pathway, TCF7 regulon, and CAR T-cell persistence. *P < 0.05, *P < 0.01, ***P < 0.001, ns: not significant.