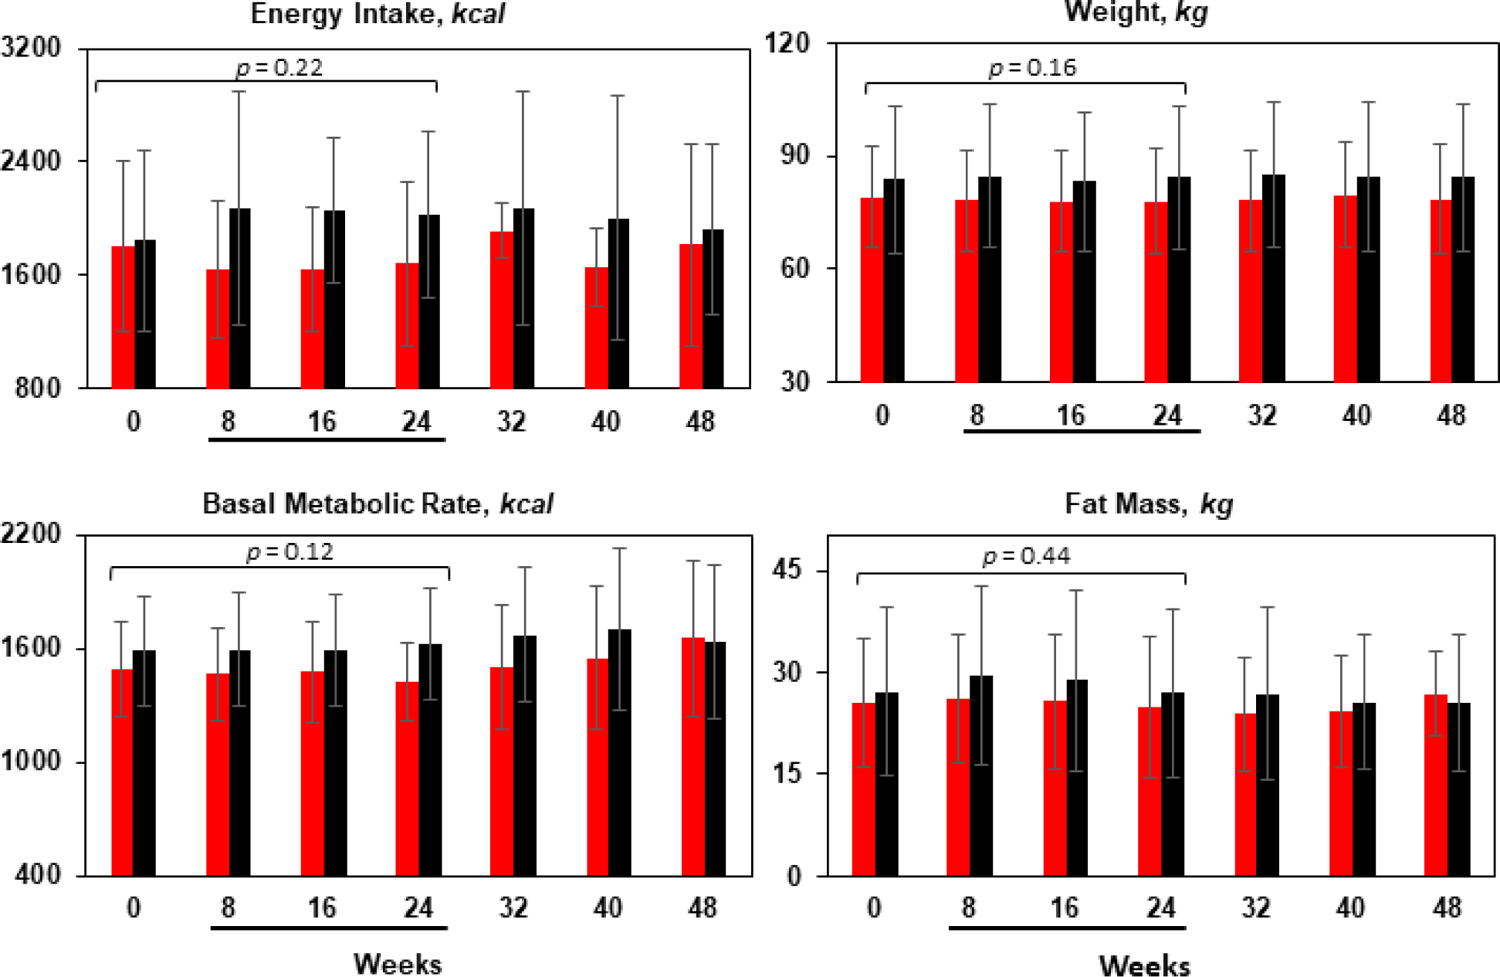
Figure 2.

Mean and SD at each study visit for INI (red bars) and placebo (black bars). There was no differences between INI and Placebo groups on energy intake, basal metabolic rate, weight and fat mass over 24 weeks of treatment and 24 weeks of follow-up. P-values are derived from linear mixed-effect models testing differences between 40 I.U. of INI and placebo after 24 weeks of treatment adjusted by time. Underlined weeks in x-axis corresponds to weeks on treatment.
