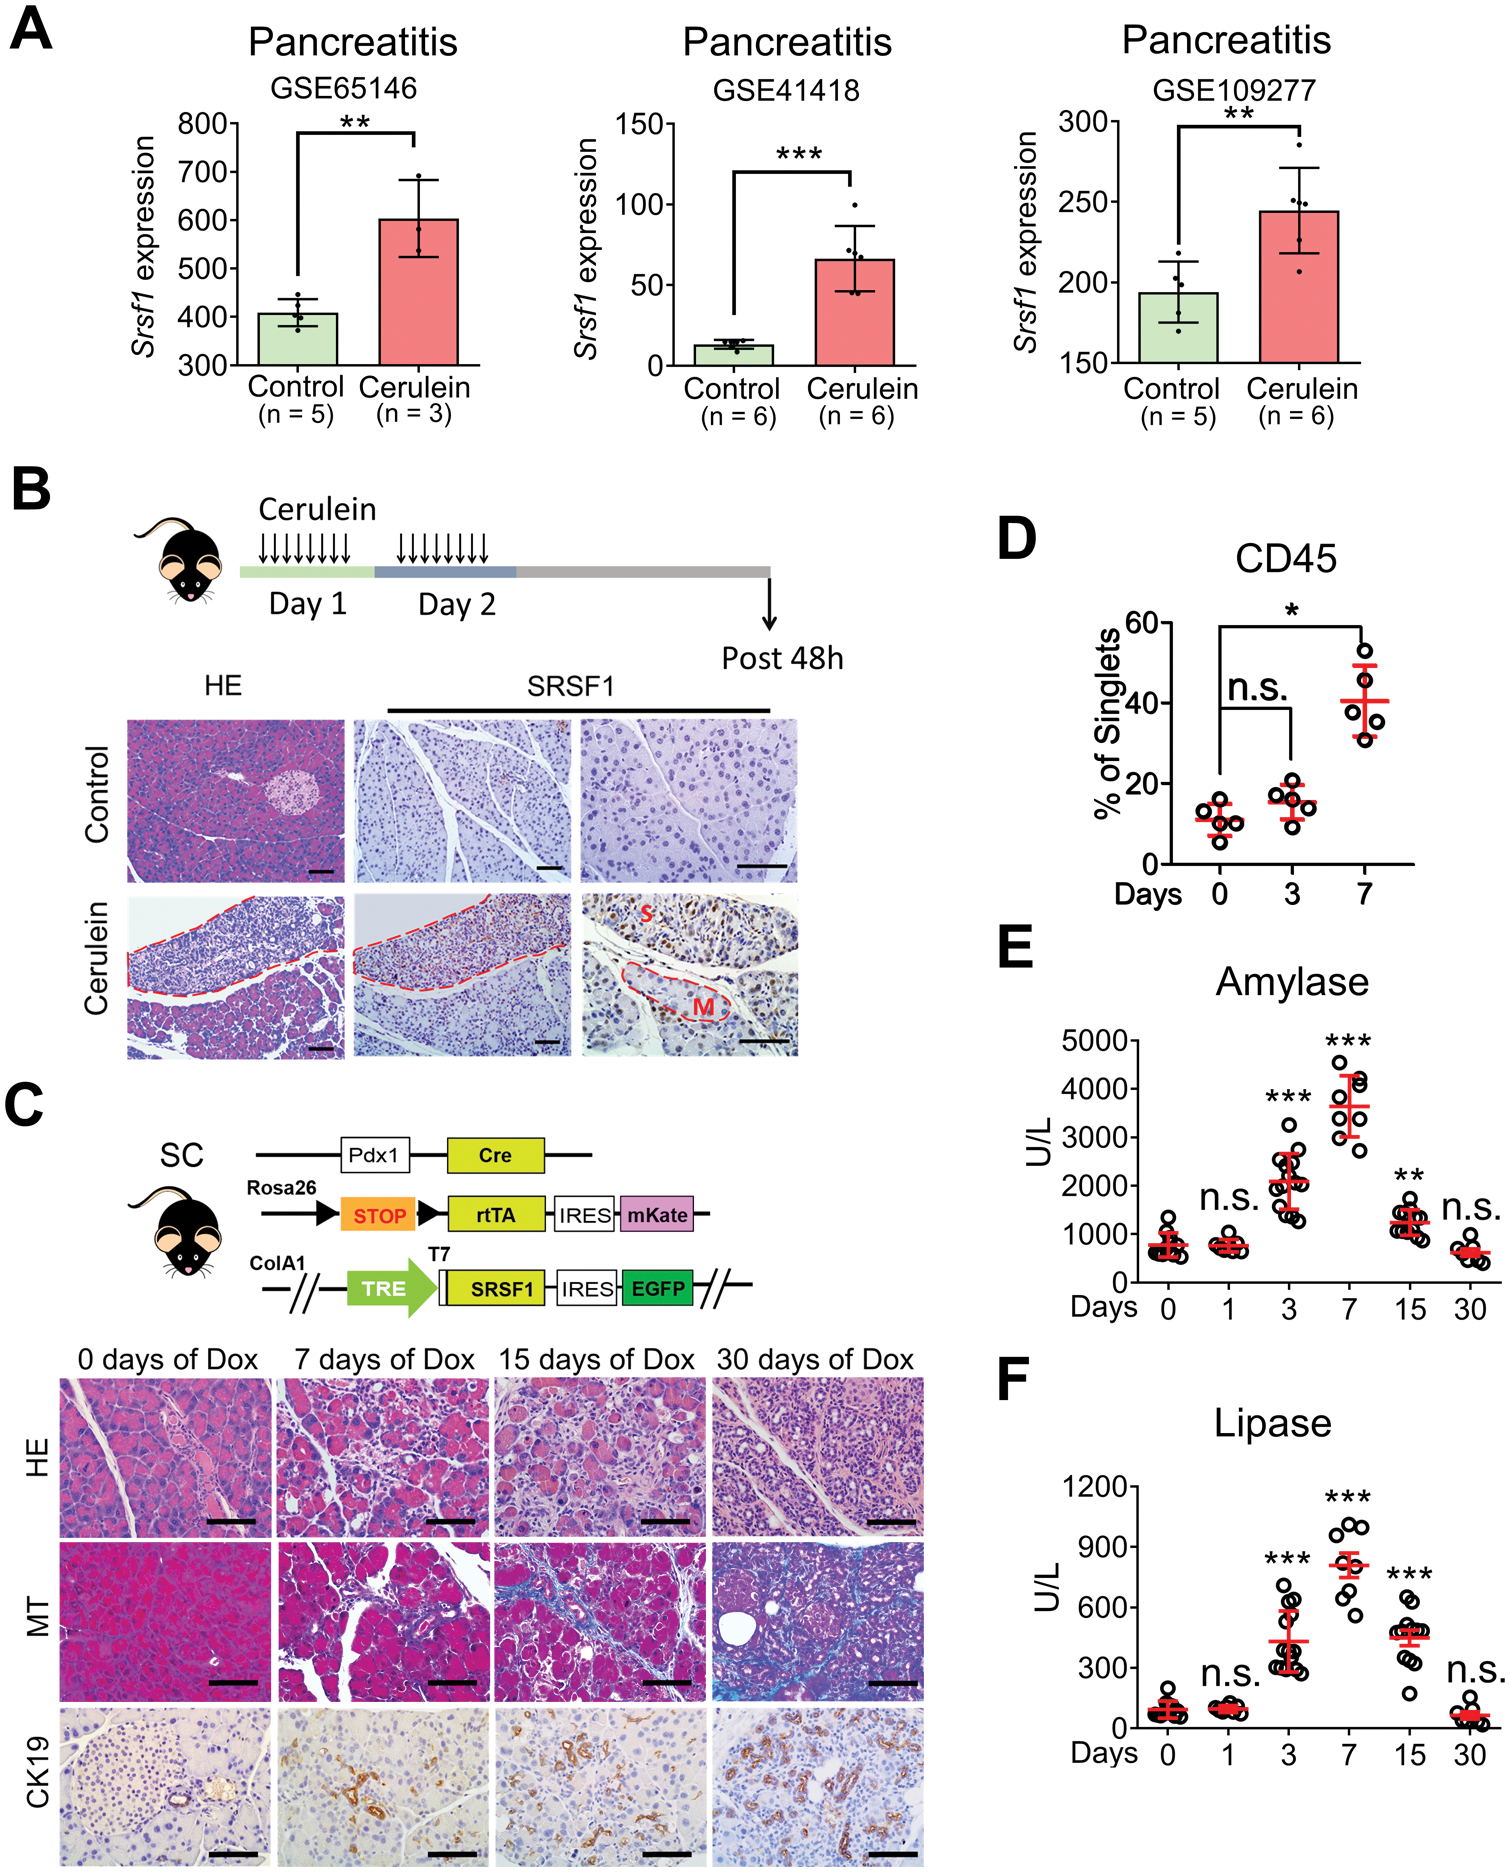
Figure 1.

SRSF1 is associated with and promotes pancreatitis. A, Srsf1 expression in control and cerulein-treated mouse pancreas from reanalysis of GSE65146, GSE41418, and GSE10927 datasets. B, Scheme for cerulein-induced pancreatitis model (top); HE and SRSF1 IHC staining (bottom) of pancreata from control (saline) and cerulein-treated mice (M, mild; S, severe pancreatitis regions). Scale bars, 50 μm. n = 5 per group. C, Scheme of SC mice and their histological evaluation by HE staining, Masson’s trichrome staining (MT) (blue indicates collagen deposition), and IHC staining of cytokeratin CK19 to identify metaplastic ductal lesions, after treatment with Dox. Scale bars, 50 μm. n = 5 per group. D, Immune-cell infiltration evaluated by flow cytometry in SC mice treated with Dox. n = 5 per group. E-F, Circulating levels (U/L) of the pancreatic enzymes amylase (E) and lipase (F) in SC mice after treatment with Dox (days). Each data point represents a measurement from an individual mouse. A, Linear models and empirical bayes methods. (D-F) Kruskal-Wallis test followed by pairwise comparisons using Wilcoxon rank-sum test. Family-wise error rate was adjusted using Bonferroni-Holm method. *p <0.05, **p < 0.01, ***p <0.001. Error bars represent mean ± SD.
