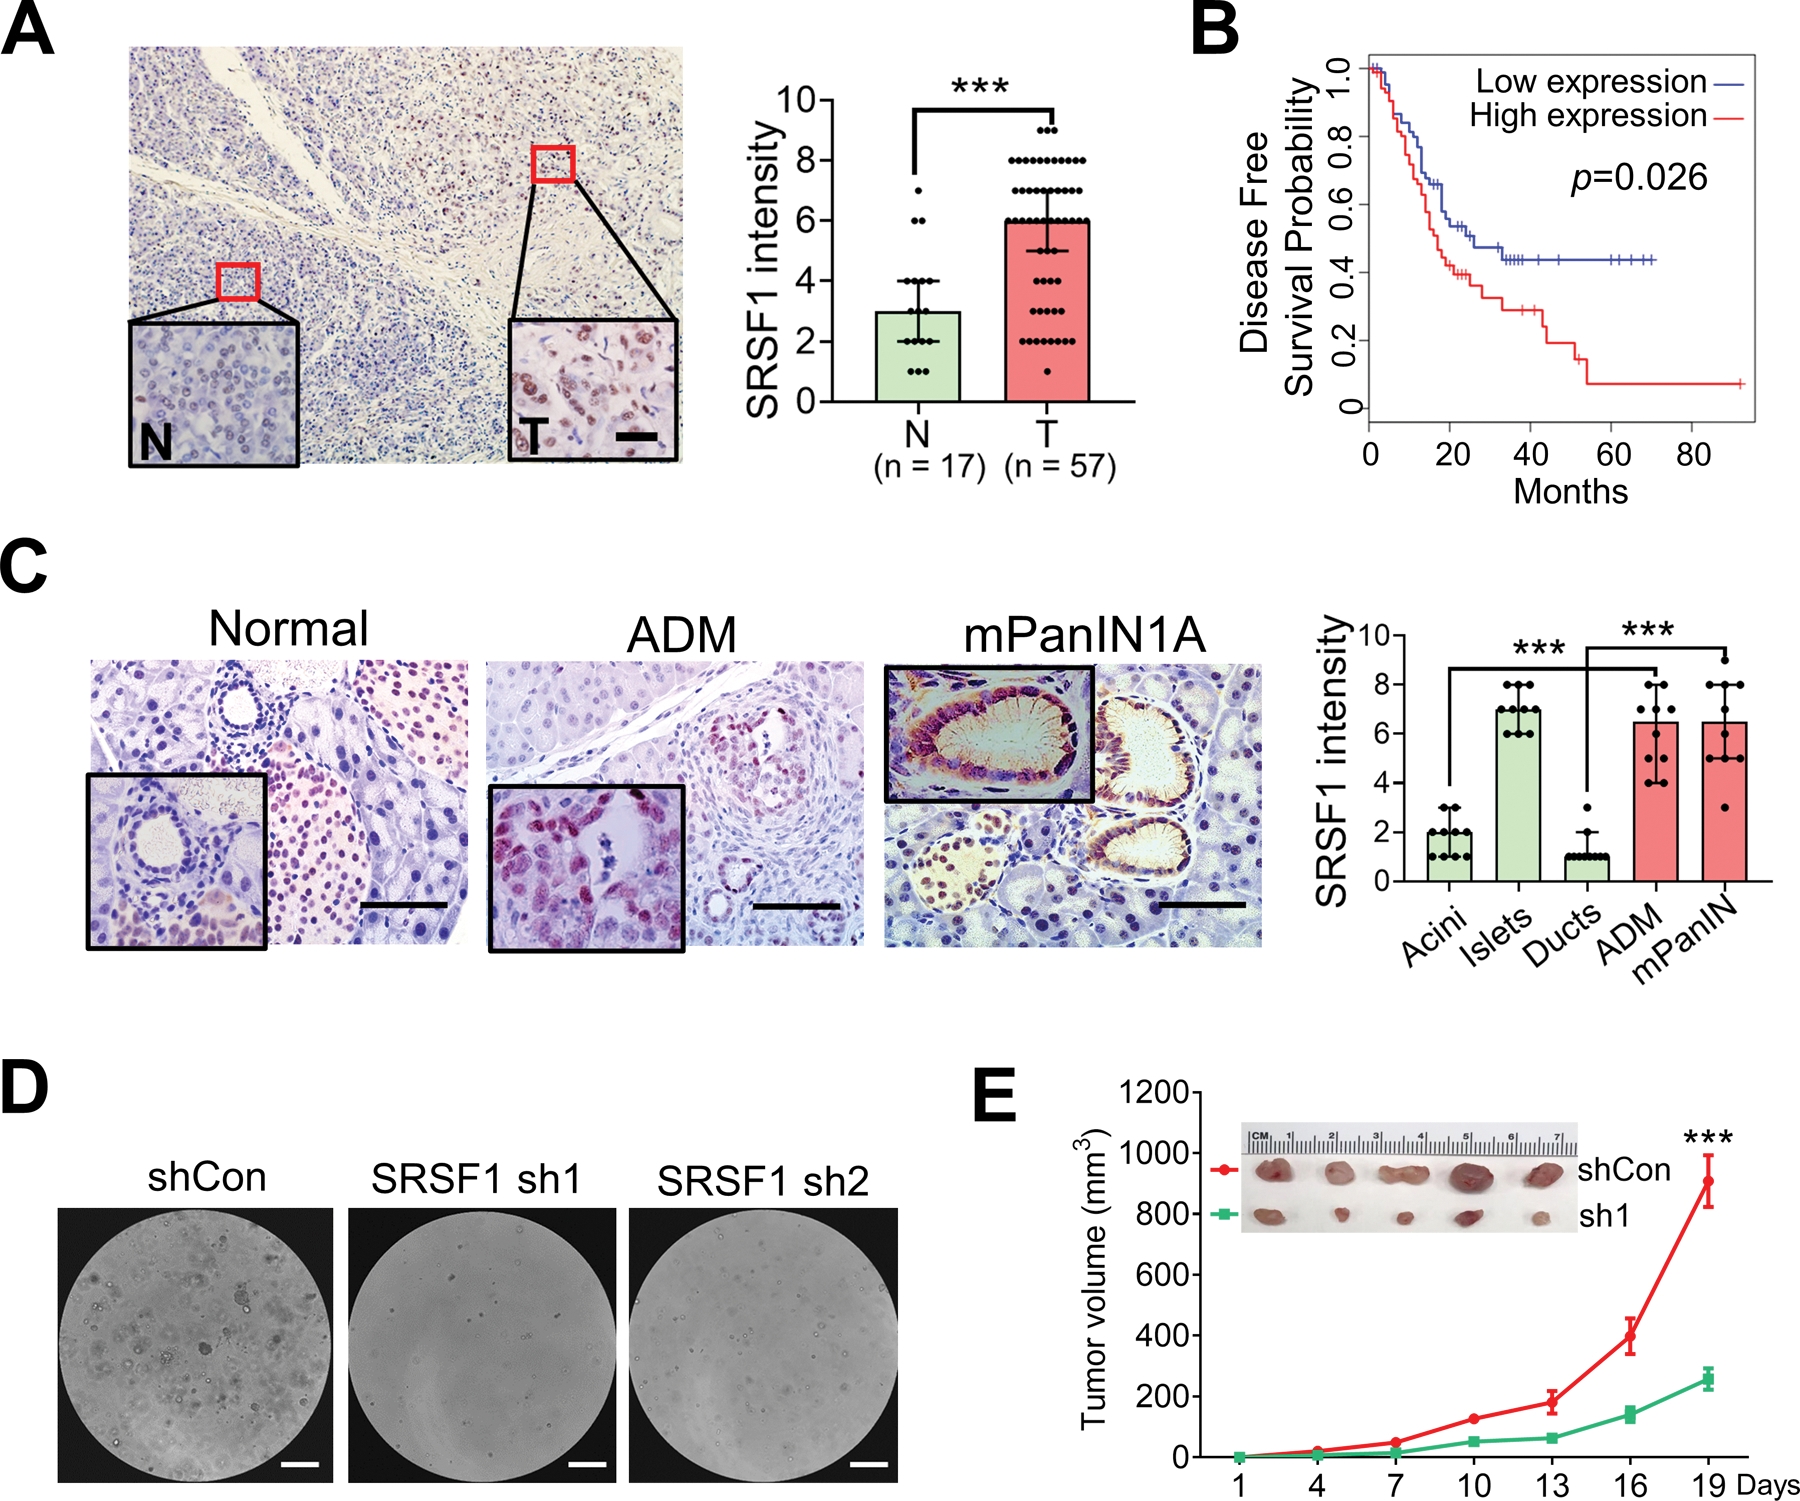
Figure 2.

Elevated SRSF1 in PDAC and precursor lesions is associated with tumor progression. A, IHC staining (left) and intensity score (right) of SRSF1 in human PDAC tumor versus normal tissue. Insets show higher magnification. Scale bars, 20 μm. Unpaired, two-tailed t test. ***p < 0.001. Error bars represent mean ± SD. B, Kaplan-Meier survival analysis of patients with PAAD from TCGA. Group cut-offs were set at the SRSF1 median mRNA expression (n = 89 per group). Log-rank Mantel-Cox test was performed. C, IHC staining (left) and intensity score (right) of SRSF1 in pancreas cells from KC mice. Insets show higher magnification of normal duct, ADM, and murine PanIN1A. Scale bars, 50 μm. For quantification of intensity, n = 10 per group. One-way ANOVA with Tukey’s multiple comparison test. ***p < 0.001. D, Human tumor hT60 organoids following knockdown with control (shCon) or SRSF1sh hairpins (sh1 & sh2). Scale bar = 200 μm. n = 3 replicates per condition. E, Tumor growth curve of subcutaneous tumors formed with SUIT-2 cells, following knockdown with control (shCon) or SRSF1sh hairpins (sh1), n = 5 per group. Upper panel represents xenograft tumors. Linear mixed-effects model with the experimental group, time and group by time interaction as fixed effects, and tumor-specific random intercept was used to fit the model. ***P <0.001.
