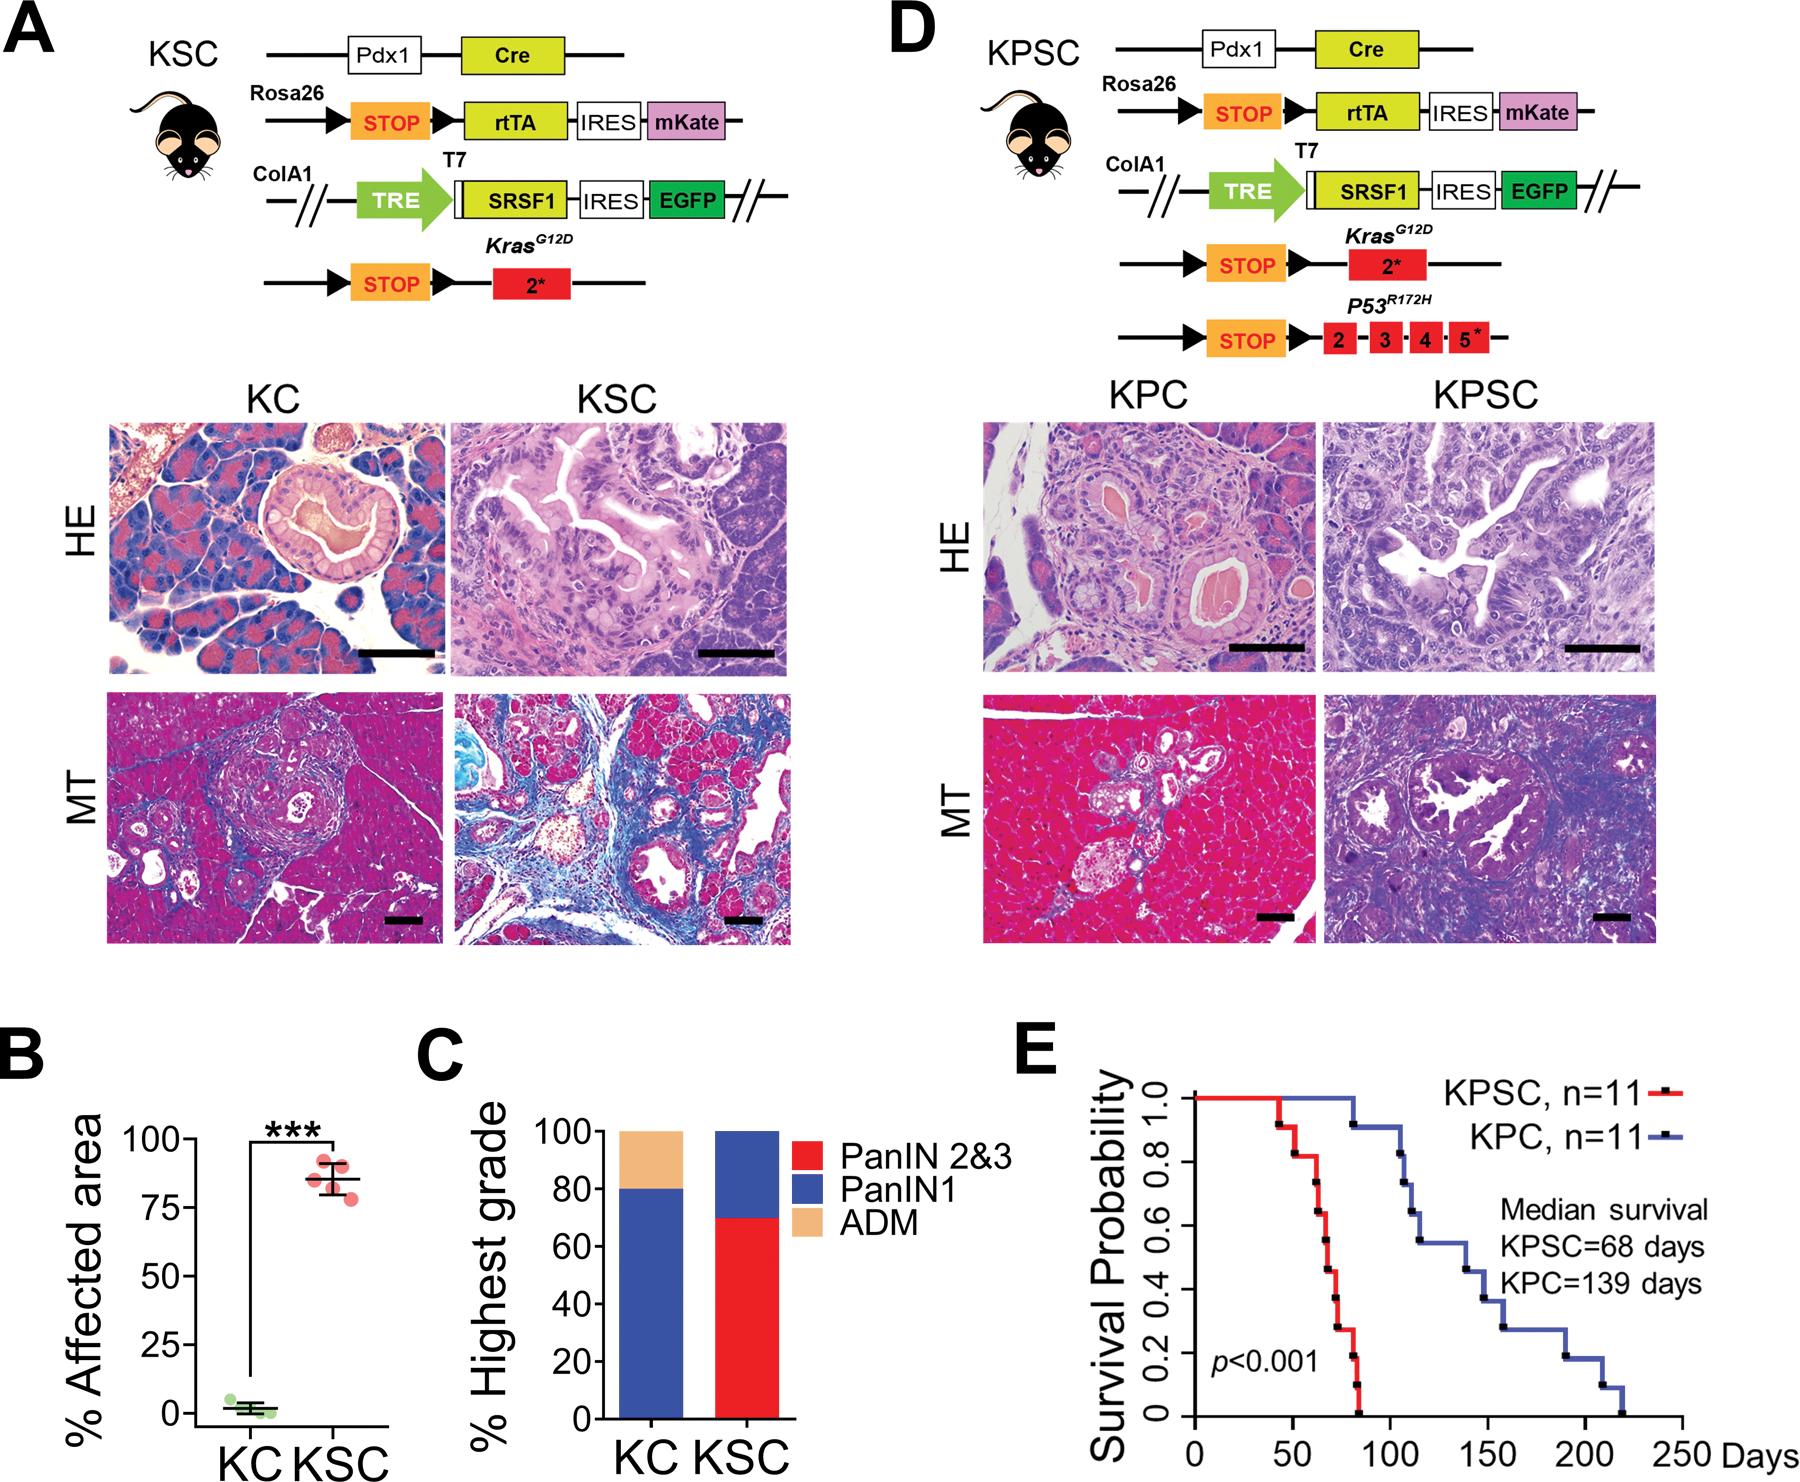
Figure 3.

SRSF1 accelerates KRASG12D-mediated tumorigenesis. A, Scheme of KSC mouse strain (top), HE and MT staining of pancreata from two-month-old KC and KSC mice (n = 5 per group). Scale bars, 50 μm. B, Quantification of the percentage of pancreatic area exhibiting histological signs of ADM and neoplasia from two-month-old KC and KSC mice (n = 5 per group). Unpaired two-tailed t test, ***p <0.001. Error bars represent mean ± SD. C, Classification of highest-grade PanIN lesions present in two-month-old KC and KSC mice (n = 5 per group). D, Scheme of KPSC mouse strain, HE and MT staining of pancreata from one-month-old KPC and KPSC mice (n = 5 per group). Scale bars, 50 μm. E, Kaplan-Meier survival analysis of KPC and KPSC mice (n = 11 per group). The p value was determined by a log-rank Mantel-Cox test.
