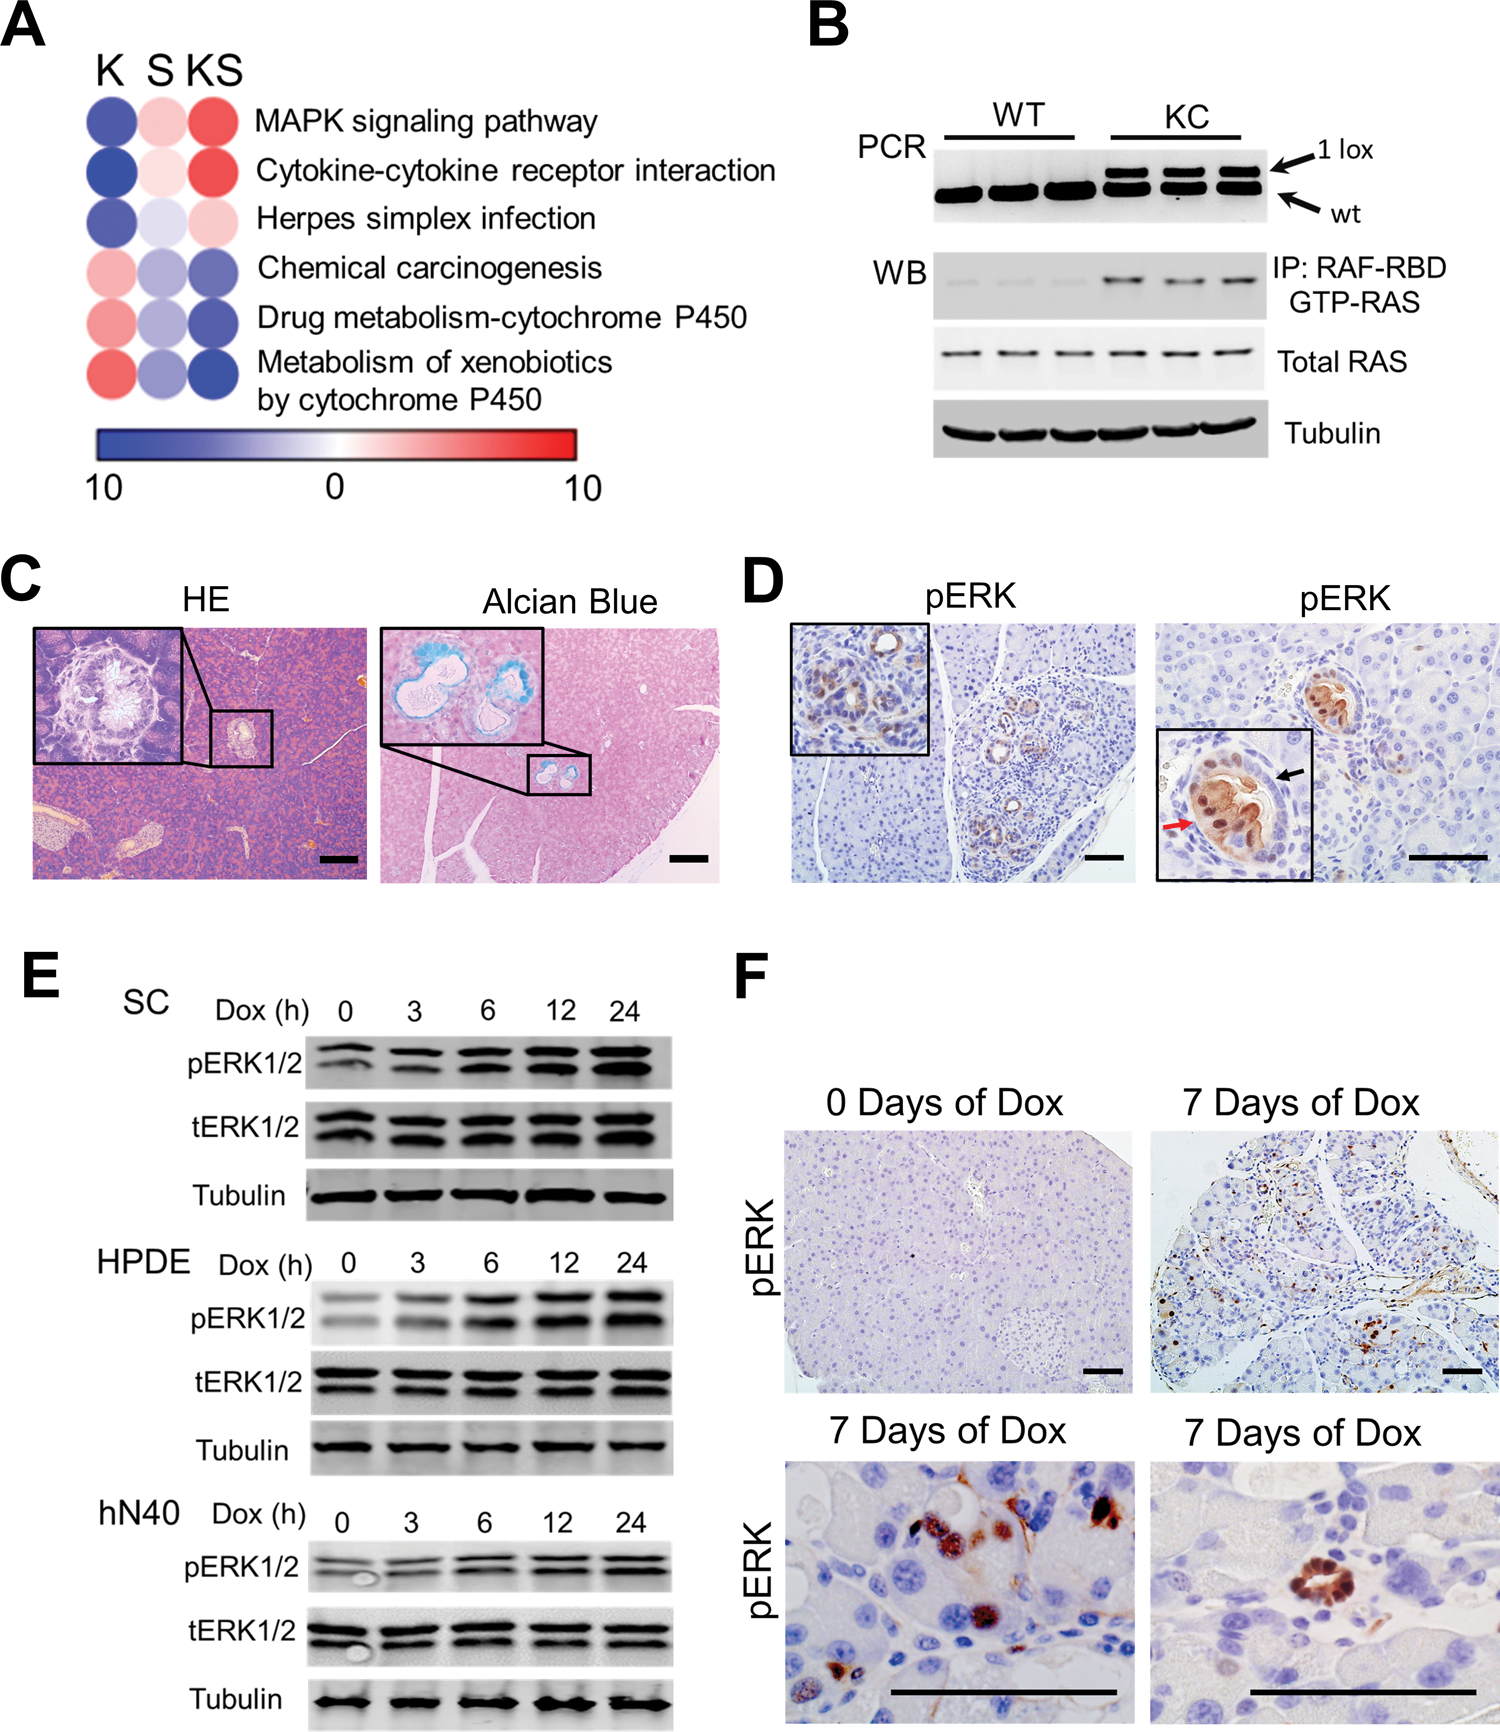
Figure 4.

SRSF1 activates MAPK signaling, a prerequisite for KRASG12D-mediated PDAC initiation. A, Pathway-enrichment analysis of genes with increased (red) or decreased (blue) expression, in KSC organoids compared to SC organoids, both without Dox treatment (K), in Dox-treated SC organoids compared to untreated SC organoids (S), and in Dox-treated KSC organoids compared to untreated KSC organoids (KS). n = 3 replicates per group. Color bar represents −log10 (p value). B, PCR of pancreatic DNA (top), and western blot of Ras-GTP and total RAS levels (bottom) from 2-month-old wild-type (WT) and KC mice (n = 3 per genotype). C, Hematoxylin and eosin (HE), and Alcian blue staining of mucin of pancreata from two-month-old KC mice (n = 5). Insets show higher magnification of murine PanIN1A lesion. Scale bars, 100 μm. D, IHC staining of pERK in 2-month-old KC pancreas tissue (n = 5). Red arrow indicates ductal cells with early-stage neoplasia; black arrow indicates normal ductal cells. Scale bars, 50 μm. E, Western blotting of phosphorylated ERK1/2 (pERK1/2), total ERK1/2 (tERK1/2), and Tubulin in SC organoids, Dox-inducible T7-SRSF1 expressing HPDE cells, and hN40 organoids, with Dox treatment. n = 3 replicates per condition. F, pERK IHC staining of SC mice after Dox treatment (n = 5 per group). Scale bars, 50 μm.
