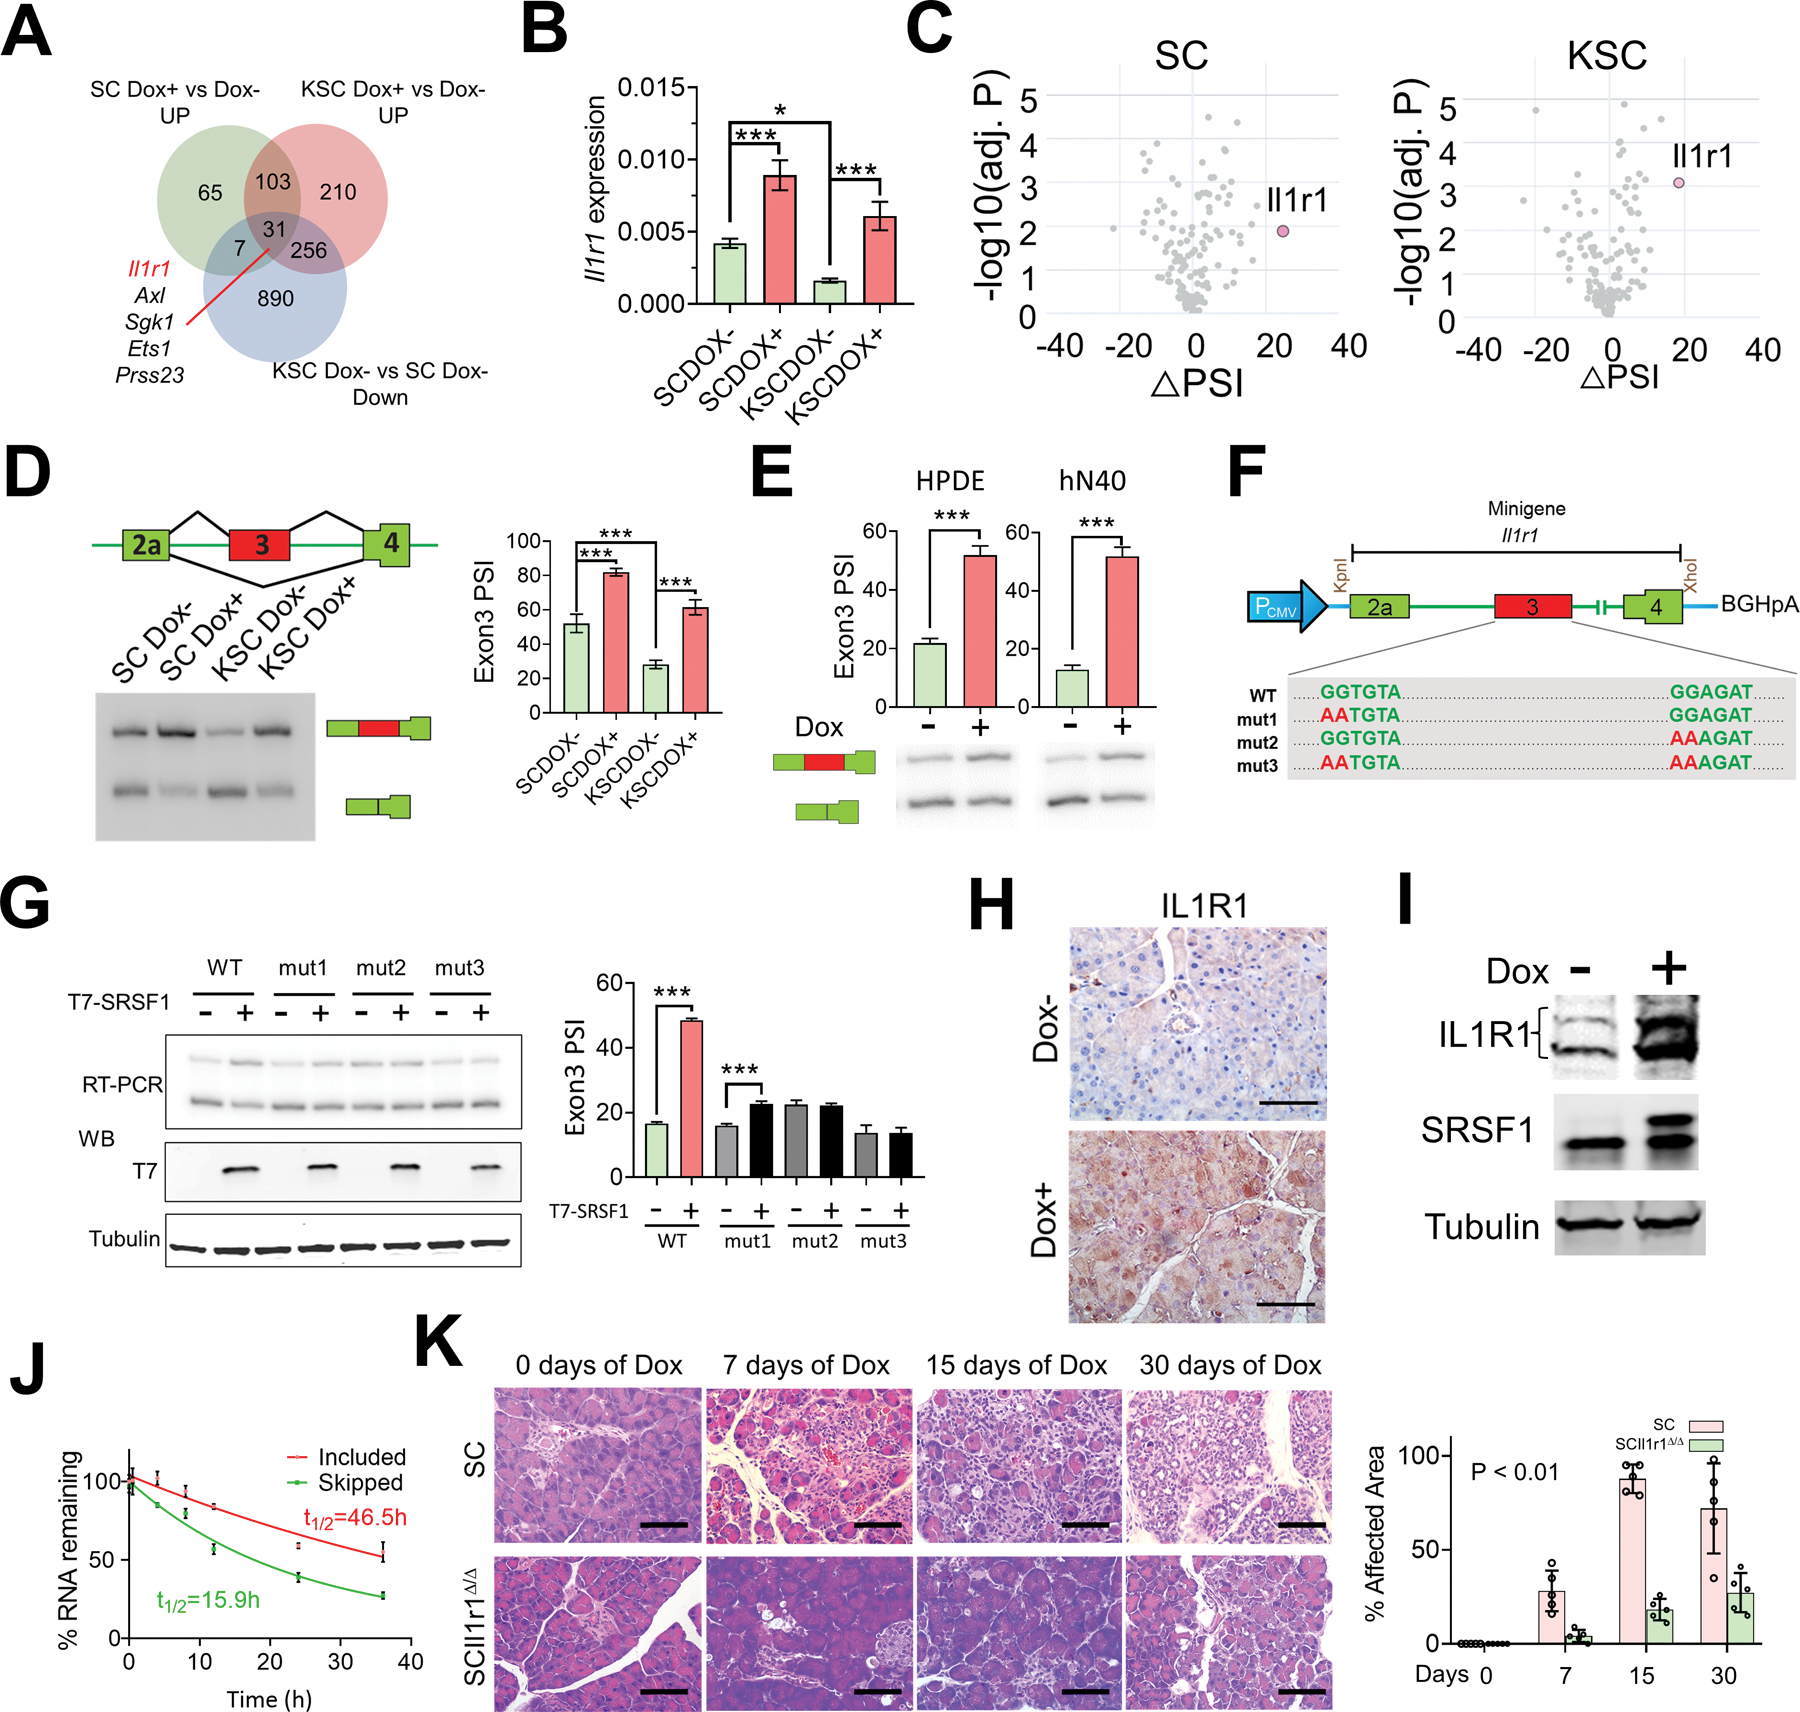
Figure 6.

SRSF1 increases IL1R1 expression through alternative splicing, contributing to pancreatitis and transformation. A, Venn diagram of genes upregulated in SC and KSC organoids treated with Dox versus untreated; and genes downregulated in KSC organoids compared to SC organoids, both without Dox treatment. B, Real-time PCR validation of Il1r1 expression changes in SC and KSC organoids treated with Dox (n = 3 biological replicates). One-way ANOVA with Tukey’s multiple comparison test. *p <0.05, ***p <0.001. Error bars represent mean ± SD. C, Volcano plots of splicing changes in MAPK signaling pathway-associated genes from SC and KSC organoids treated with Dox. D, Scheme and radioactive RT–PCR of SRSF1-regulated splicing event in Il1r1 pre-mRNA from SC and KSC organoids treated with Dox. The percent spliced in (PSI) was quantified for each condition (right, n = 3 biological replicates). One-way ANOVA with Tukey’s multiple comparison test. ***p <0.001. Error bars represent mean ± SD. E, Radioactive RT–PCR of SRSF1-regulated splicing event in Il1r1 pre-mRNA from Dox-inducible T7-SRSF1-expressing HPDE cells and human normal pancreatic hN40 organoids treated with Dox. The percent spliced in (PSI) was quantified for each condition (top panel, n = 3 biological replicates). Unpaired two-tailed t test. ***p <0.001. Error bars represent mean ± SD. F, Diagram of Il1r1 minigene. Mutations were introduced to disrupt SRSF1 binding motif(s). G, Radioactive RT-PCR results of Il1r1 minigene assays (top left), and Western blotting of T7-tag (bottom left) in 293T cells overexpressing T7-SRSF1. The percentage of exon 3 inclusion was quantified for each condition (right, n = 3 biological replicates). One-way ANOVA with Tukey’s multiple comparison test. ***p <0.001. Error bars represent mean ± SD. H, IHC staining of IL1R1 in pancreas tissues from SC mice with Dox treatment for 3 days (n = 5 per group). Scale bars, 50 μm. I, Western blotting of IL1R1, endogenous and T7-tagged SRSF1 in SC organoids treated with Dox. J, mRNA-decay assay of the Il1r1 isoforms in SC organoids harvested at the indicated times after actinomycin D treatment. mRNAs were quantified by real-time PCR, normalized to Gapdh levels, and expressed as a percentage of the levels at time 0 h (n = 3 biological replicates). K, HE staining of pancreata of SC and SCIl1r1Δ/Δ mice with Dox treatment (n = 5 per group). Scale bars, 50 μm. The affected area was quantified on the right. Statistical analysis was performed by a linear mixed-effects model with the experimental group, time, and group by time interaction as fixed effects, and the sample-specific random intercept was used to estimate the % affected area.
