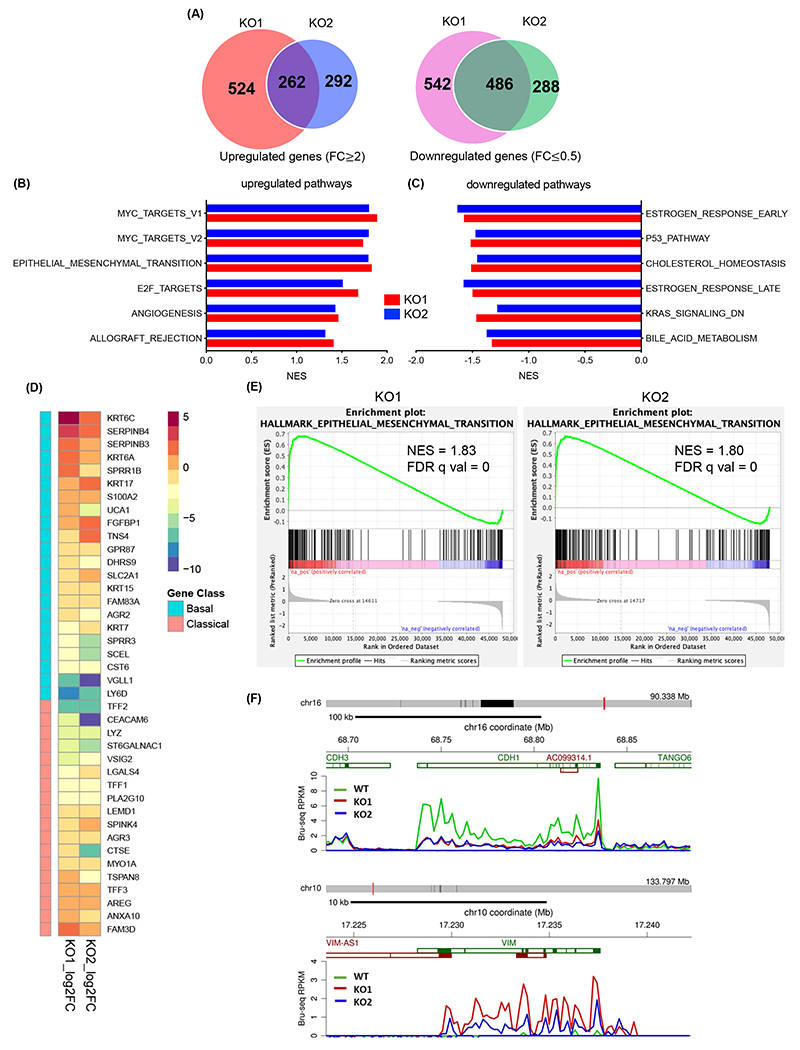
Fig. 3.

KMT2D knockout induced epigenetic reprograming. (A) Venn diagrams of differentially transcribed genes compared to control in 2 KMT2D knockout (KO) BxPC-3 clones using Bru-seq. (B, C) Top six hallmark pathways that are upregulated (B) or downregulated (C) in KMT2D KO BxPC-3 cells compared to control cells identified by Gene Set Enrichment Analysis (GSEA). (D) Heat map of altered gene signature in 2 KMT2D KO BxPC-3 clones according to the Moffitt gene sets defining the classical or basal-like subtypes of PDAC16. (E) EMT pathway signature enrichment plots in 2 KMT2D KO BxPC-3 clones. NES: normalized enrichment score, FDR q val: false discovery rate. (F) Bru-seq analysis showing de novo transcripts of CDH1 and VIM in wild-type (WT) and KMT2D KO BxPC-3 cells.
