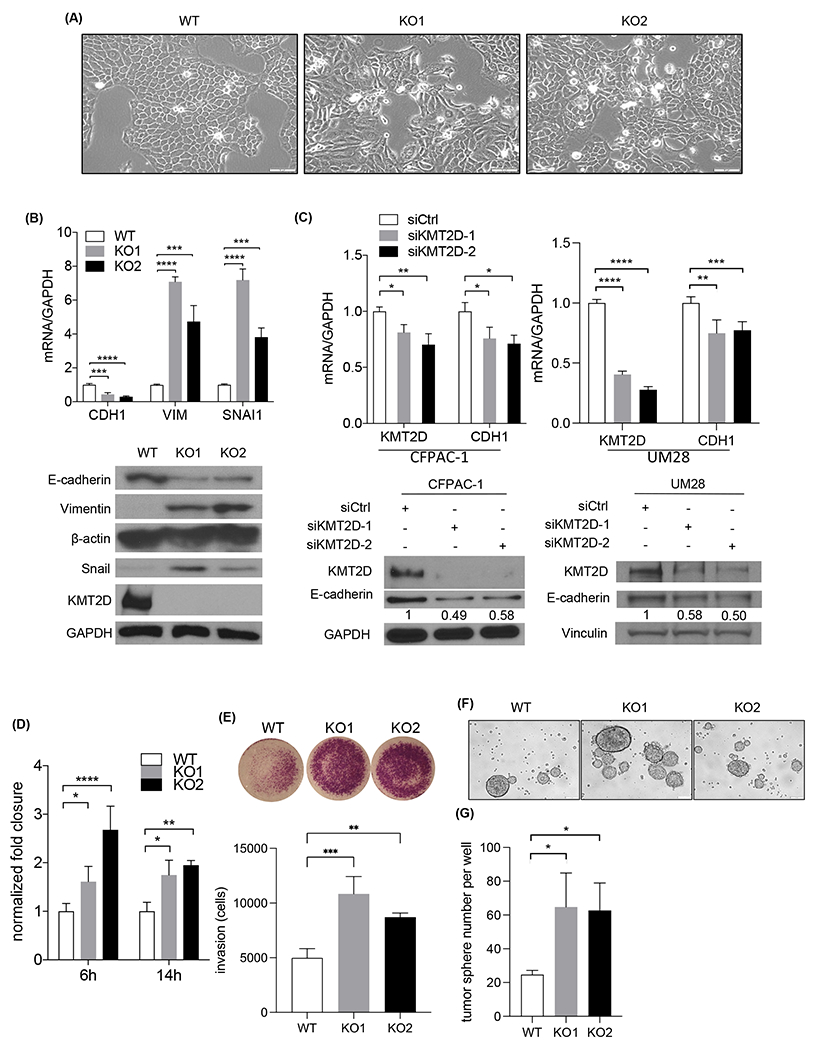
Fig. 4.

Loss of KMT2D promotes EMT, migration, invasion, and tumorigenicity. (A) Phase-contrast images of BxPC-3 wild-type (WT) and 2 KMT2D knockout (KO) clones in culture. Scale bar = 100 μm. (B) Western blot and quantitative real-time PCR of KMT2D, E-cadherin (CDH1), Vimentin (VIM), and Snail (SNAI1) expression in WT and 2 KMT2D KO BxPC-3 clones. Quantification of bands was shown relative to WT. GAPDH was used as control and reference. (***p<0.005, ****p<0.001, one-way ANOVA test with Dunnett’s multiple comparisons test, n=3) (C) Immunoblot and quantitative real-time PCR of KMT2D and E-cadherin (CDH1) in CFPAC1 and UM28 PDAC cells treated with scramble (siCtrl) or KMT2D siRNA (siKMT2D) for six days. GAPDH was used as control. Quantification of immunoblot bands were shown relative to siCtrl. (*p<0.05, **p<0.01, one-way ANOVA test with Dunnett’s multiple comparisons test (left) and unpaired student t-test (right), n=3) (D) Normalized fold wound closure in WT and KMT2D KO BxPC-3 cells at 6 and 14 hours after scratch. (*p<0.05, **p<0.01, ***p<0.005, ****p<0.001, two-way ANOVA test with Dunnett’s multiple comparisons test, n=3) (E) Invaded cells in KMT2D KO BxPC-3 cells normalized to WT at 48 hours after seeding by transwell invasion assay. (**p<0.01, ***p<0.005, one-way ANOVA test with Dunnett’s multiple comparisons test, n=3) (F) Representative pictures of WT and KMT2D KO BxPC-3 cell tumor spheres. (G) Quantification of tumor spheres in WT and KMT2D KO BxPC-3 cells. (*p<0.05, one-way ANOVA test with Dunnett’s multiple comparisons test, n=3)
