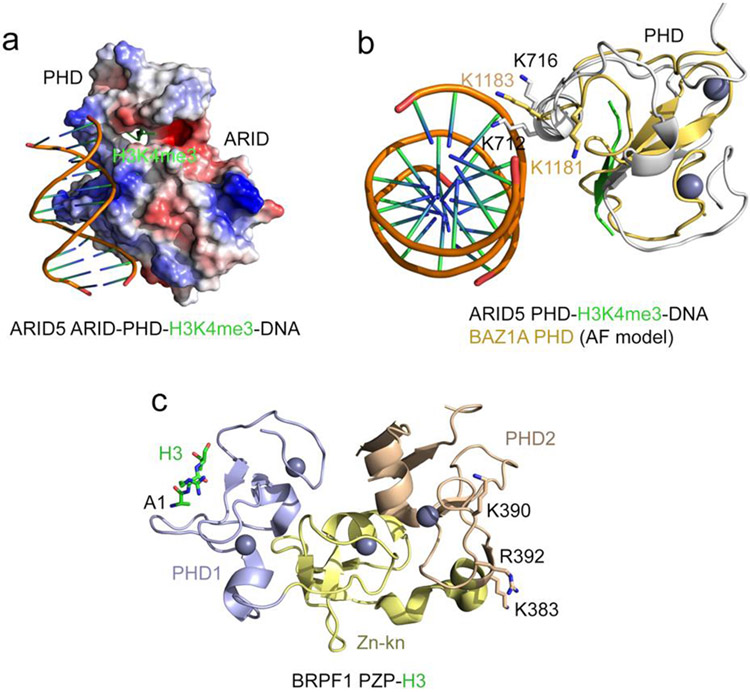
Figure 3: DNA binding function of PHD fingers.
(a) Electrostatic surface potential of the ARID5 ARID-PHD cassette in complex with H3K4me3 peptide and DNA (PDB: 6LQF). Blue and red colors represent surface positive and negative charges, respectively. The H3K4me3 peptide is depicted as green ribbon. (b) Overlay of the structure of the ARID5 ARID-PHD cassette (grey) in complex with H3K4me3 peptide (green) and DNA (PDB: 6LQF) and the AlphaFold model of the PHD finger of BAZ1 (light orange) (UniProt ID: Q9NRL2). (c) A ribbon diagram of the crystal structure of the BRPF1 PZP domain in complex with H3 (PDB ID: 6U04). The H3 tail is N-terminally linked to PZP. The H3 tail is shown as green sticks, the zinc ions are grey spheres, and the positively charged residues of PHD2 involved in binding to DNA are shown as sticks and labeled.

