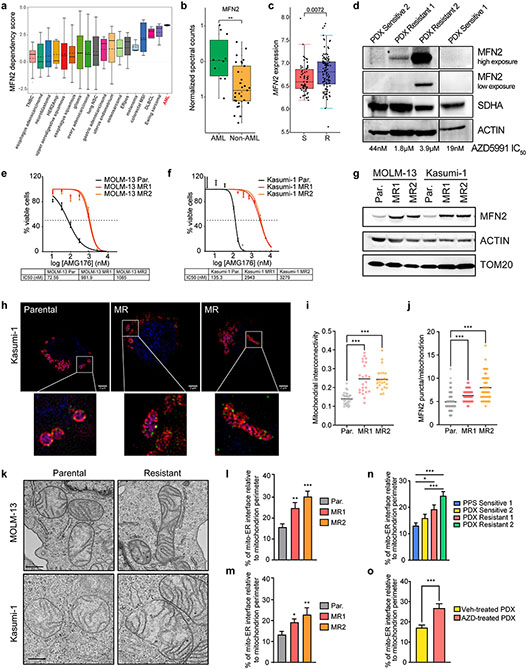
Figure 2. MFN2 and mitochondria-ER interactions participate in the acquisition of BH3-mimetics resistance.
a. MFN2 dependency scores across a diverse panel of 563 cancer cell lines from DepMap. A positive score signifies a stronger gene dependency.
b. Quantification of normalized MFN2 spectral counts in AML and other hematologic malignancies based on mass spectrometry-based data from Cancer Cell Line Encyclopedia44.
c. MFN2 expression in BeatAML cohorts with Sensitive (S, IC50 < 0.25 μM) vs Resistant (R, IC50 < 0.25 μM) patients to venetoclax.
d. Western blotting in total cell lysates from patient-derived primary or xenografted AML blasts. MCL1i (AZD5991) IC50 values of each patient sample were calculated after 48 hrs ex vivo treatment.
e-f. IC50 curves of MCL1i (AMG176) in parental (Par.) or MCL1i-resistant (MR) AML cell lines after 48 hrs treatment (MOLM-13; e, Kasumi-1; f) (n=3, mean ± SD).
g. Western blotting in total cell lysates from Par. and MR AML cell lines.
h. Representative z-stack projection (upper) and single z-stack (lower) images from super-resolution microscopy of Parental or MR MOLM-13 and Kasumi-1 cells stained with mitoTracker (magenta), TOM20 (red), MFN2 (green) and DAPI (blue). Scale bars represent 2 μm.
i. Quantification of mitochondrial interconnectivity (area/perimeter) in Kasumi-1 cells in (h).
j. Measurement of MFN2 puncta per individual mitochondrion in Kasumi-1 cells in (h).
k. Representative electron micrographs of mitochondria and their interactions with ER from Par. or MR MOLM-13 and Kasumi-1 cells. Scale bar represents 0.5 μm.
l-m. Quantification of the mitochondria-ER contacts in experiments as in (k), in MOLM-13 (l) and Kasumi-1 (m) cells. Graphs depict the percentage of mitochondria-ER interface relative to the mitochondrial perimeter (n=30, mean ± SEM).
n. Graph depicting the percentage of mitochondria-ER interface relative to the mitochondrial perimeter as quantified in electron micrographs from patient AML blasts (n=45, mean ± SEM).
o. Quantification of the percentage of mitochondria-ER interface relative to the mitochondrial perimeter in electron micrographs from PDX Resistant 1 cells harvested from mice treated weekly with vehicle or 100 mg/kg AZD5991 for 28 days (n=30, mean ± SEM).
The p values were determined by unpaired two-tailed t-test.

