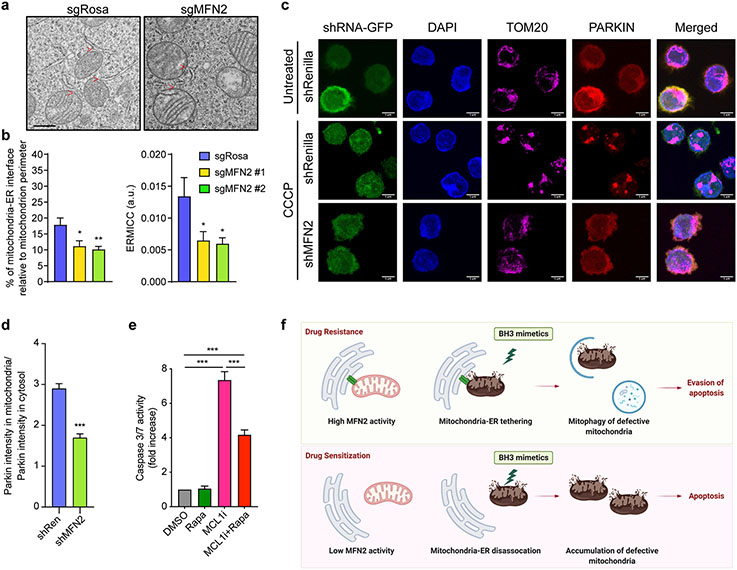
Figure 6. Knockout of MFN2 decreases mitochondrial clearance through autophagy.
a. Representative electron micrographs of mitochondria from Cas9-expressing MOLM-13 infected with sgRNA targeting MFN2 or Rosa. Scale bar represents 0.5 μm, red arrows indicate mitochondria-ER interactions.
b. Quantification of the mitochondria-ER contacts in experiments as in (a). The percentage of the mitochondria-ER interface relative to the mitochondrial perimeter (left) and ER-mitochondrial contact coefficient (ERMICC; right) are shown (n = 21, mean ± SEM). ERMICC = interface length / (mitochondrial perimeter × mitochondria-ER distance)94.
c. Representative z-stack projections of confocal 3D images of PARKIN-mCherry-overexpressing MOLM-13 cells transduced with the indicated shRNAs (GFP+), treated with 10 μM CCCP or DMSO for 2 hrs, and stained for TOM20 (magenta; mitochondria). Scale bars represent 5 μm.
d. Quantification of PARKIN translocation onto mitochondria (colocalization index) relative to the cytosolic PARKIN in experiments described in (c) in CCCP-treated cells.
e. Caspase 3/7 assay in MFN2 KO Kasumi-1 cells treated with AZD5991 (MCL1i, 1 μM, 8 hrs) and rapamycin (Rapa, 250 nM, 26 hrs). Data represent mean ± SEM of three independent biological replicates.
f. Schematic diagram of the study.

