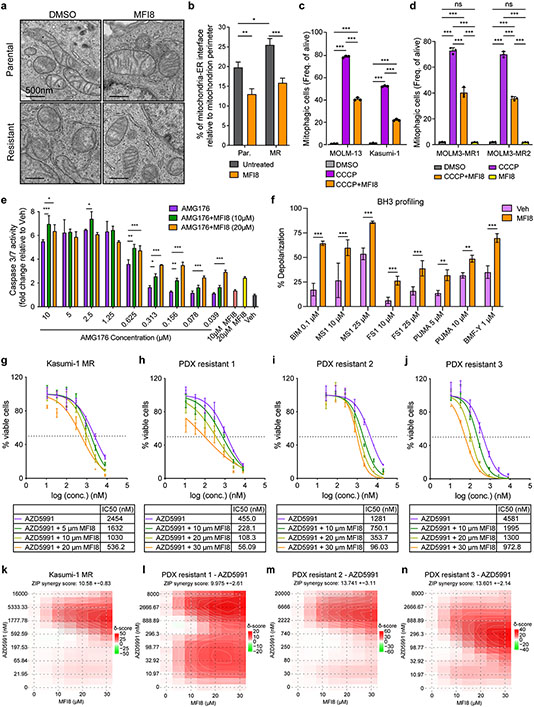
Figure 7. Pharmacologic targeting of MFN2 sensitizes AML cells to BH3-mimetics.
a. Representative electron micrographs of mitochondria and their interactions with ER from MOLM-13 parental or MR (resistant) cells treated for 6 hr with 20 μM MFI8. Scale bars represent 500 nm.
b. Quantification of MAMs in experiments in MOLM-13 cells as in (a). Graphs depict the percentage of mitochondria-ER interface relative to the mitochondrial perimeter (n=40 mitochondria, mean ± SEM).
c. Bar graphs depicting the mitophagic events in mitoKeima-expressing MOLM-13 and Kasumi-1 cells treated with 10 μM CCCP and 10 μM MFI8 for 16 hrs, as quantified by flow cytometry.
d. Bar graphs depicting the mitophagic events in mitoKeima-expressing MOLM-13-MR1 and MOLM-13-MR2 cells treated with 10 μM CCCP and 10 μM MFI8 for 16 hrs, as quantified by flow cytometry.
e. Caspase 3/7 activation in MOLM-13 cells treated with increasing concentrations of AMG176 and MFI8 16 hrs post-treatment (n=3, mean ± SD).
f. BH3 profiling in MOLM-13 MR cells following MFI8 treatment (6 hrs pre-treatment and 3 hrs during the course of the experiment; 20 μM). The percentage of mitochondrial membrane depolarization was measured (n=4, mean ± SD).
g-n. Dose-response curves (g-j) and matrices (k-n) of AZD5991 and mitofusin inhibitor (MFI8) from indicated cell lines and xenografts. Treatments were performed for 24 hrs (PDXs) or 48 hrs (cell line) before viability measurements using Cell Titer Glo. Data represent mean ± SD (n=3).
The statistical analysis was performed using two-way ANOVA.

