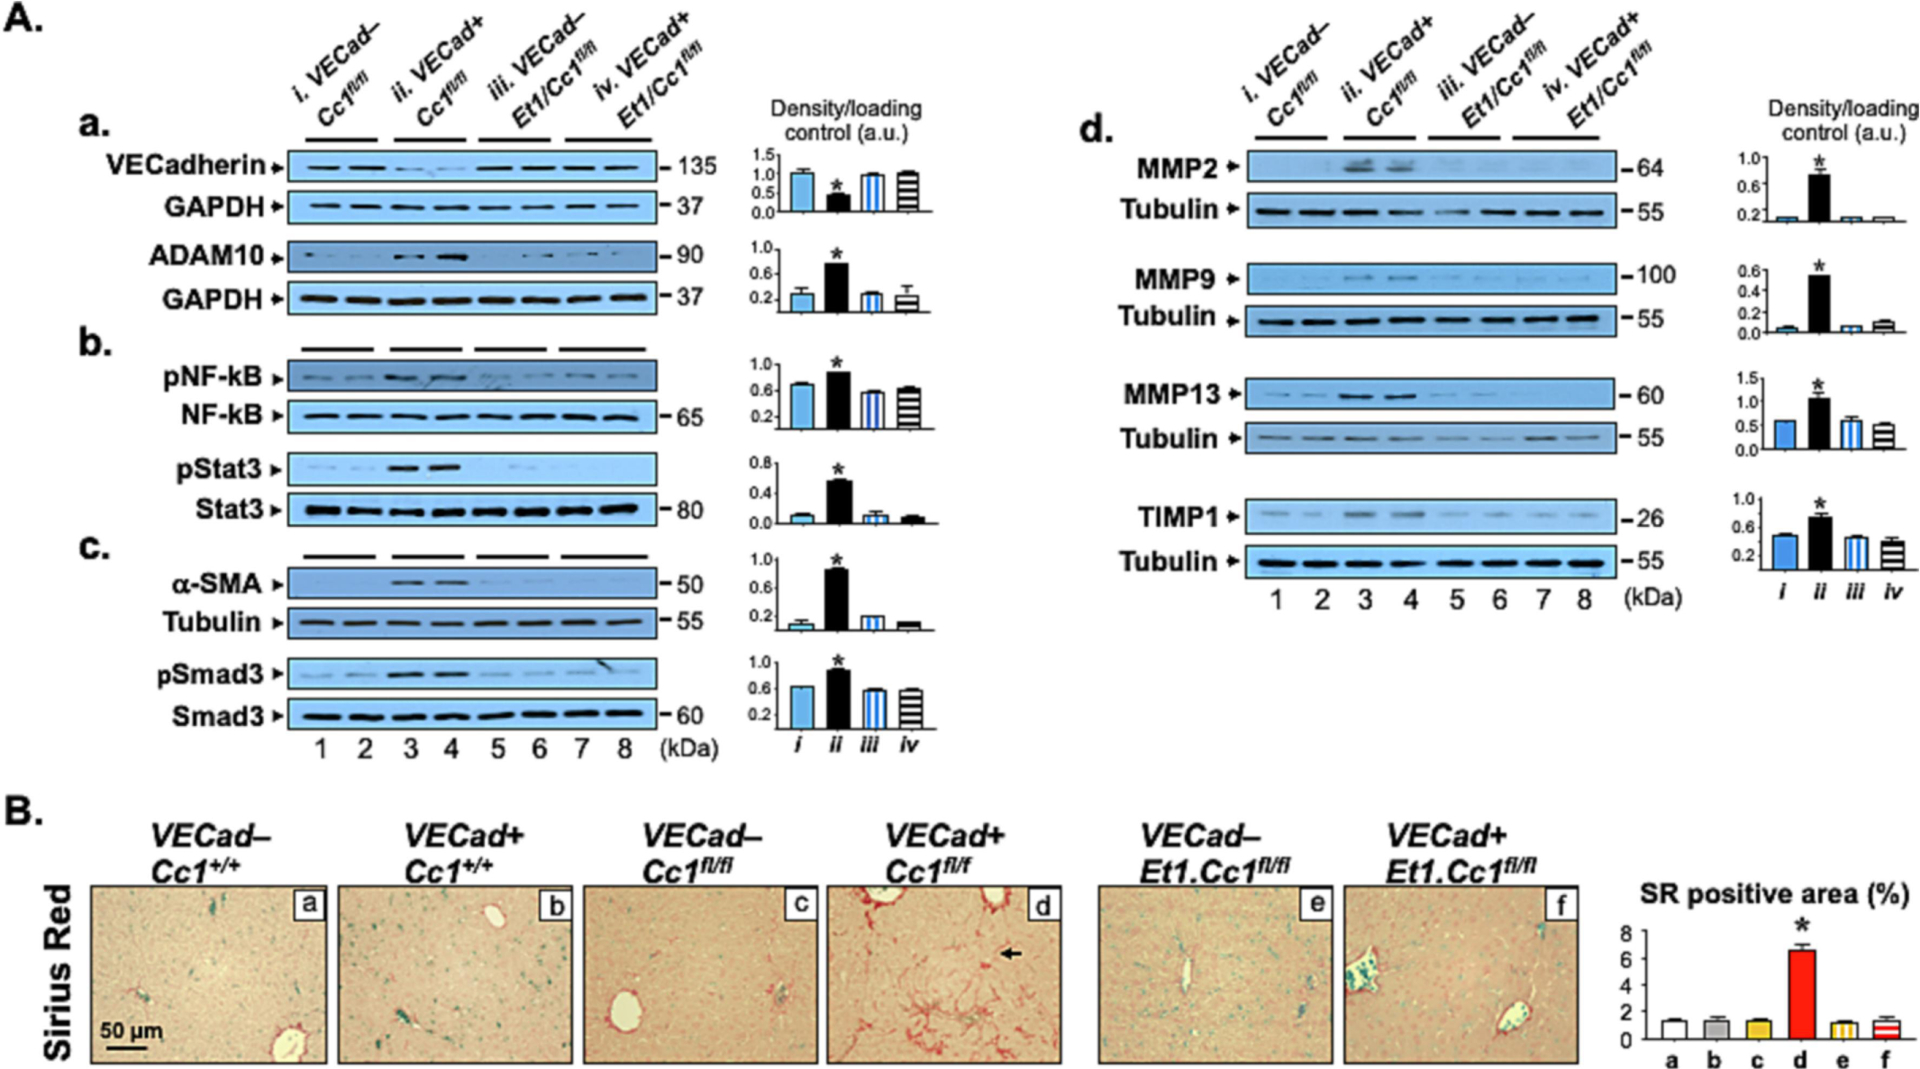
Fig. 2. Analysis of fibrosis.

Livers from mice described in Fig. 1 were excised to carry out: (A) Western Blot analysis on liver lysates from VECad+Cc1fl/fl male mice (lane 3–4) and their VECad−Cc1fl/fl littermate Flox controls (lane 1–2), and from VECad+Et1.Cc1fl/fl double mutants (lane 7–8) and their VECad–Et1.Cc1fl/fl double Floxed controls (lane 5–6). Representative gels indicate the protein levels of VE-Cadherin and ADAM10, normalized against GAPDH applied on parallel gels (panel a), the activation (phosphorylation) of NF-κB and Stat3 inflammatory pathways using phospho-antibodies normalized against total loaded NF-κB and Stat3 proteins analyzed on parallel gels (panel b), α-SMA protein levels, normalized against tubulin, and the amount of phosphorylated Smad3 normalized against total protein loaded to assess TGFβ activation (panel c), and MMP-2, -9, -13 and TIMP-1 protein content, normalized against tubulin (panel d). Gels represent two different mice/genotype. The apparent molecular mass (kDa) is indicated at the right hand-side of each gel. Each group represent 2 different mice/genotype. Gels were scanned using image J (v1.53t) and the density of the test band was divided by that of its corresponding loading control and represented in arbitrary units (a.u) in the accompanying graph. (B) Sirius Red staining was performed to detect interstitial and bridging (arrow) chicken-wire deposition of collagen fibers in VECad+Cc1fl/fl (panel d). Representative images are shown. 8–10 randomly selected high-power fields (20x) per sample were imaged and quantified with ImageJ (v1.53t) to determine the percentage of Sirius red (SR) stain area within the whole area of imaged hepatic tissue. Briefly, each image was RGB-stacked, subjected to standardized thresholding of individual channel to isolated Sirius Red stain and then quantified as %area. Image quantifications were averaged and the mean within each experimental group was plotted in the accompanying graph.
