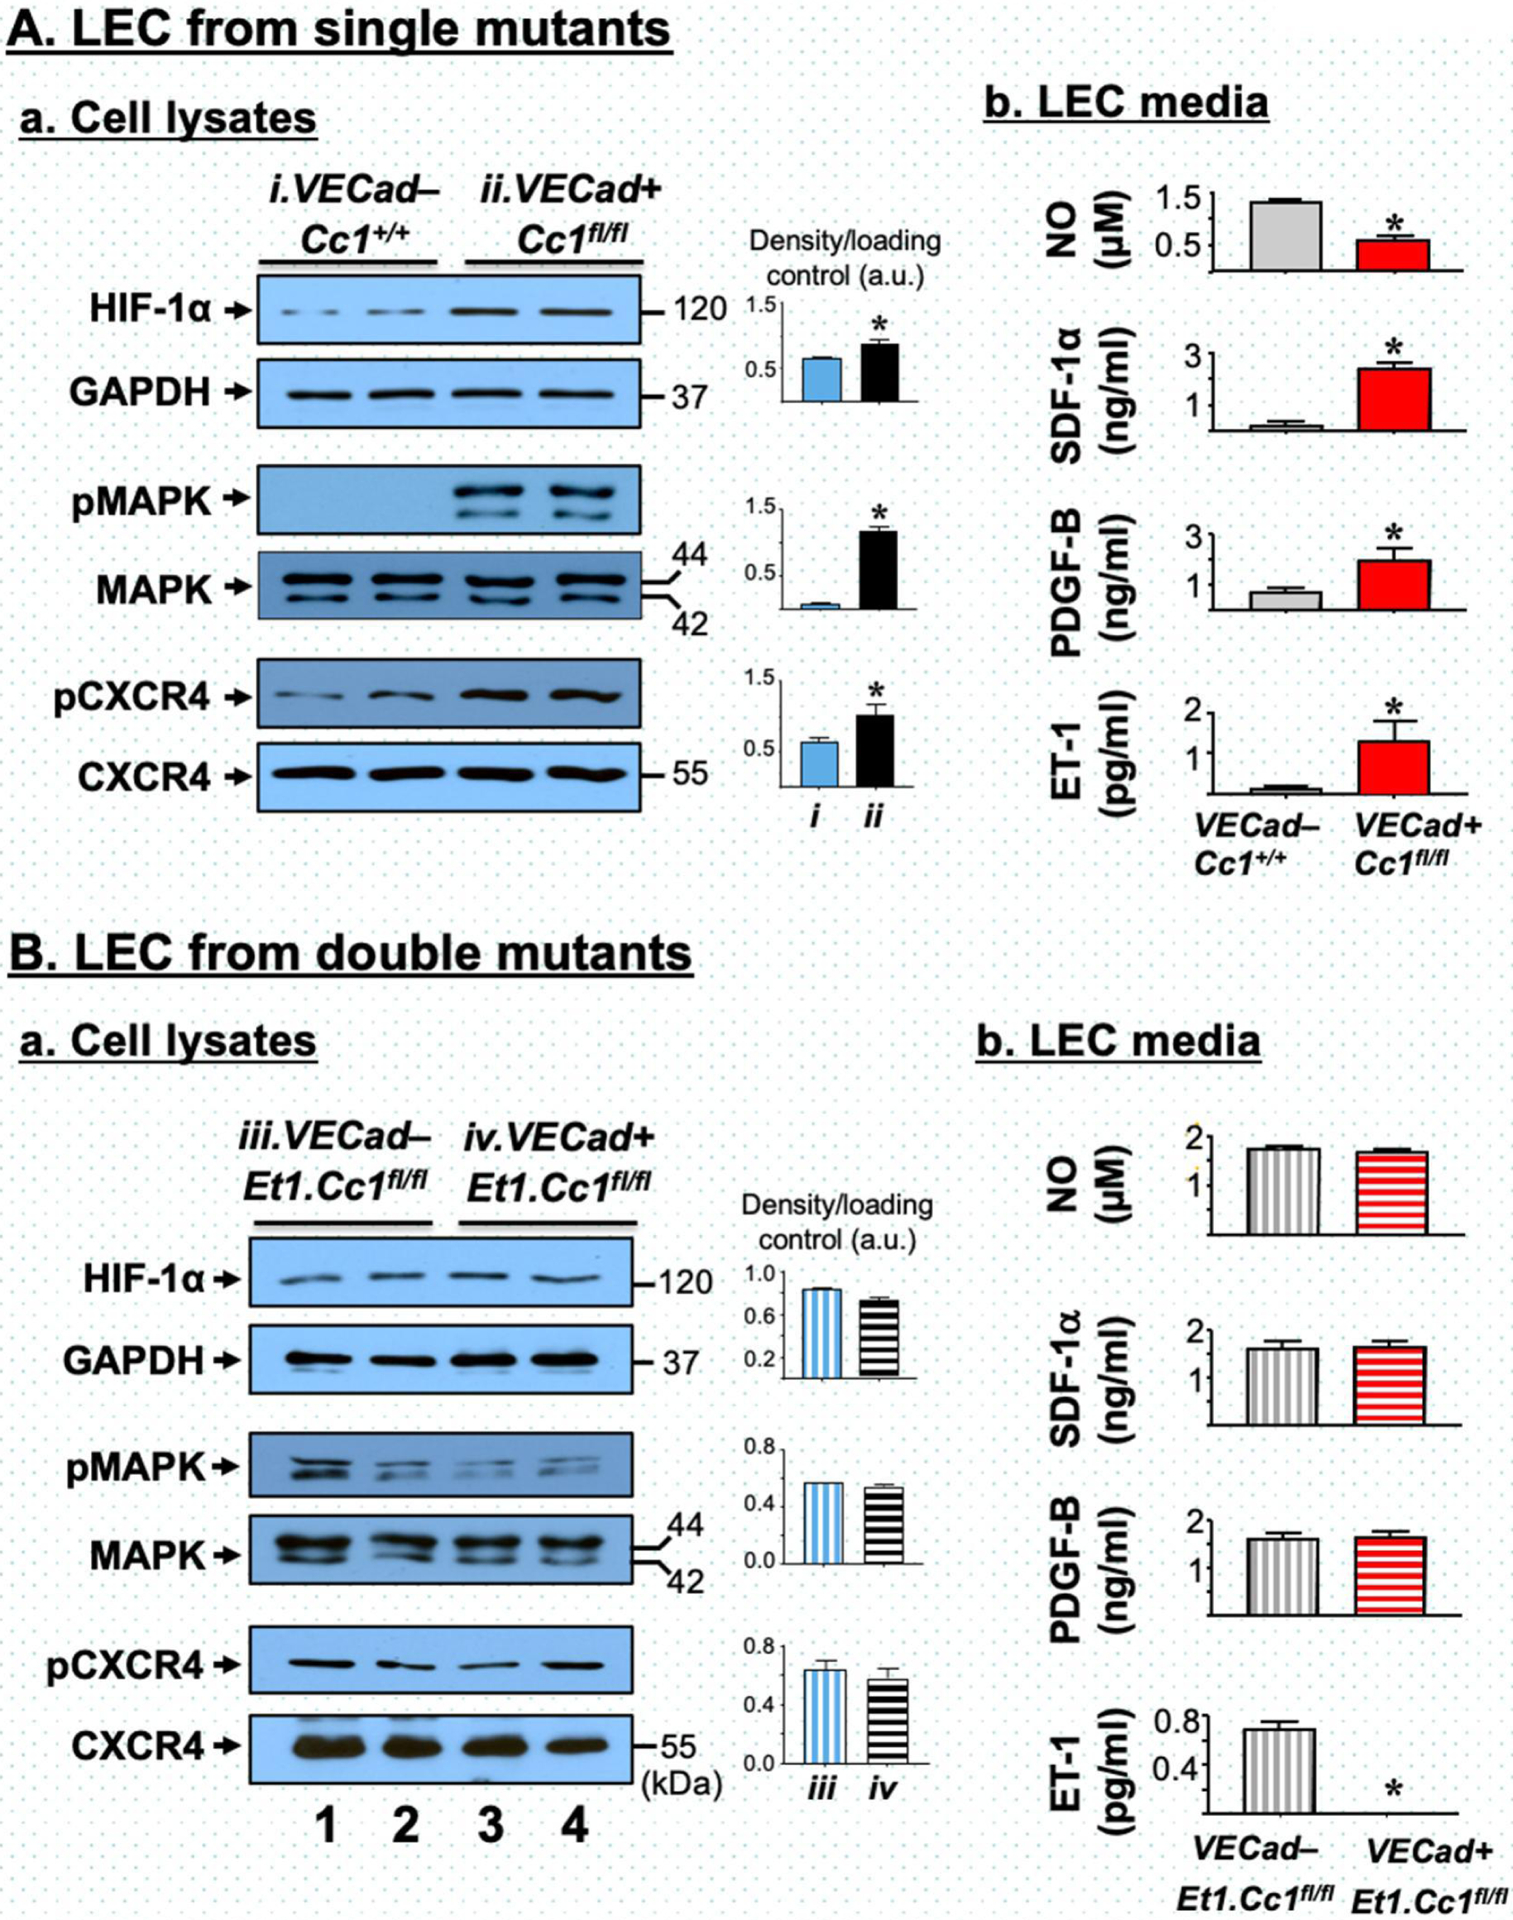
Fig. 3.

Analysis of primary liver endothelial cells. Liver endothelial cells (LEC) were prepared from 2-month-old VECad+Cc1fl/fl single mutants (A) and VECad+Et1.Cc1fl/fl double mutants (B) with their respective Flox controls. In panels a, Western blot analysis was performed on LEC lysates, as described in the legend to Fig. 2 with lane 1–2 depicting 2 different LEC preparations from control mice and lane 3–4 from mutant mice. Band densities were calculated as in the legend to Fig. 2 and represented in the accompanying graphs. In panels b, levels of NO, SDF-1α, PDGF-B and ET1 in LEC media were determined in triplicate. Values were expressed as mean ± SEM. *P<0.05 vs controls.
