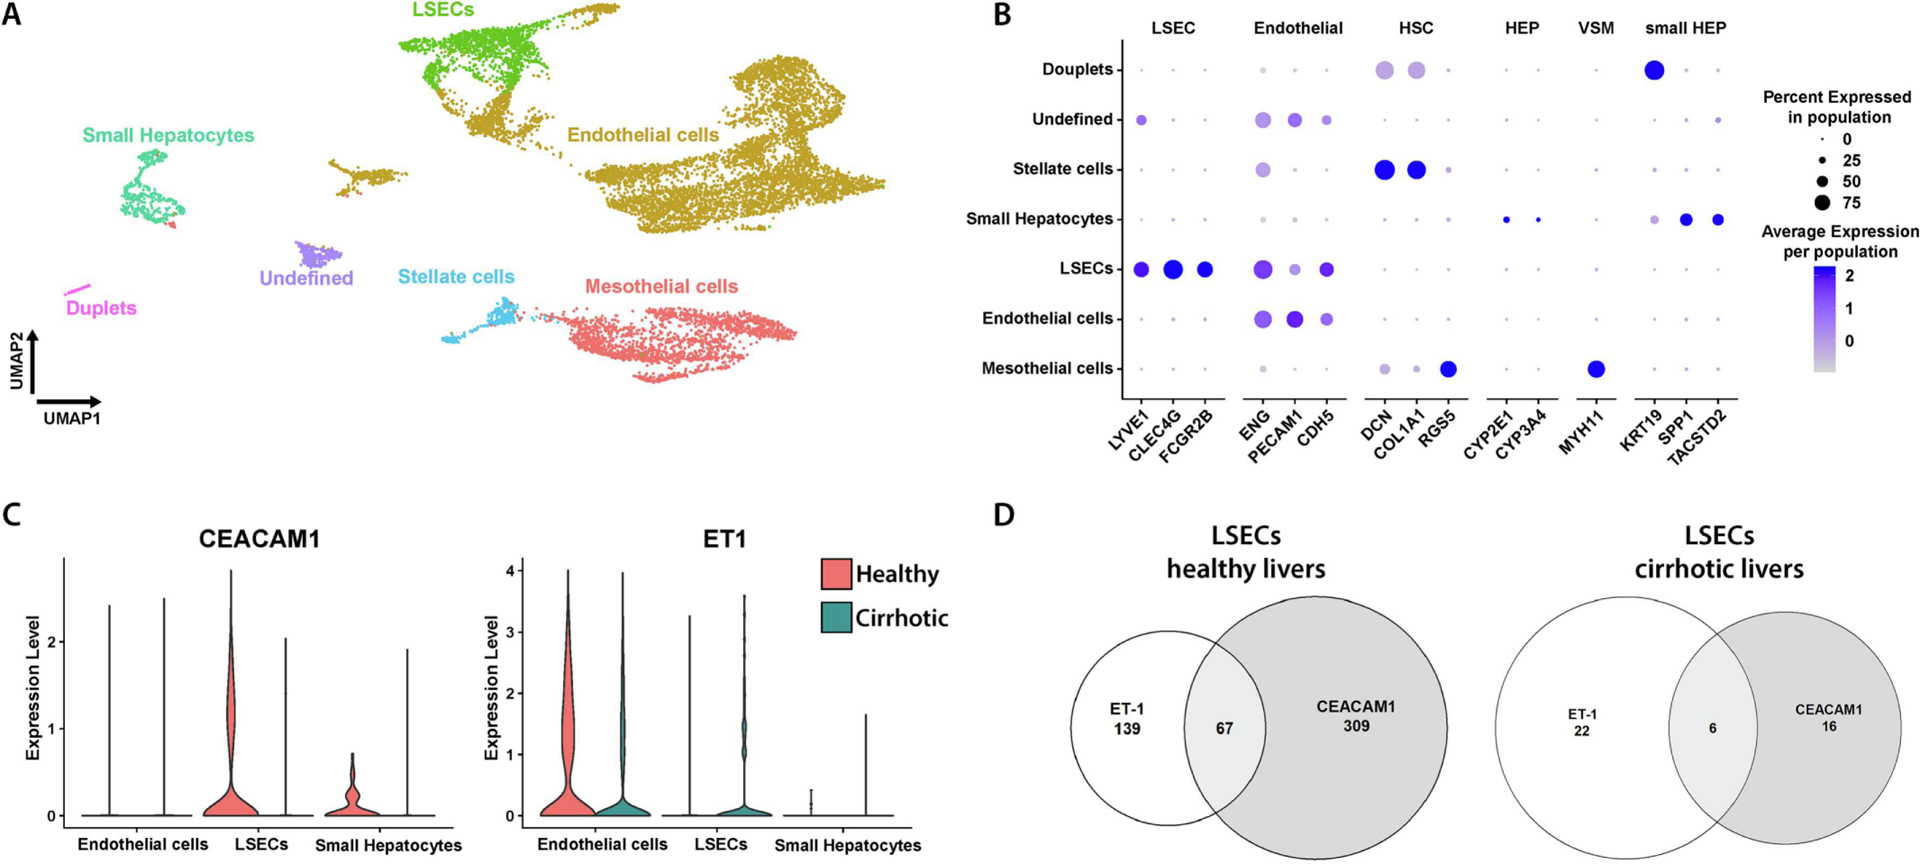
Fig. 6.

Reclustering of different cell populations in the liver explants. (A) Uniformed Manifold Approximation and Projection (UMAP) visualization of annotated clusters in the healthy and cirrhotic livers. (B) Dotplot of expression of cell-type specific markers in each annotated cluster. (C) Violin plot representing CEACAM1 and ET1 mRNA levels in endothelial cells, LSECs and hepatocytes from scRNA-sequencing data from human livers. The expression levels in red represent healthy liver (n=5) explants and those in teal represent cirrhotic liver (n=4) explants. (D) Venn diagram of gene expression of CEACAM1 (grey section) and ET1 (white section) expressed in healthy and cirrhotic LSECs. The overlapping region (light grey) represents the cells positive for both CEACAM1 and ET1.
