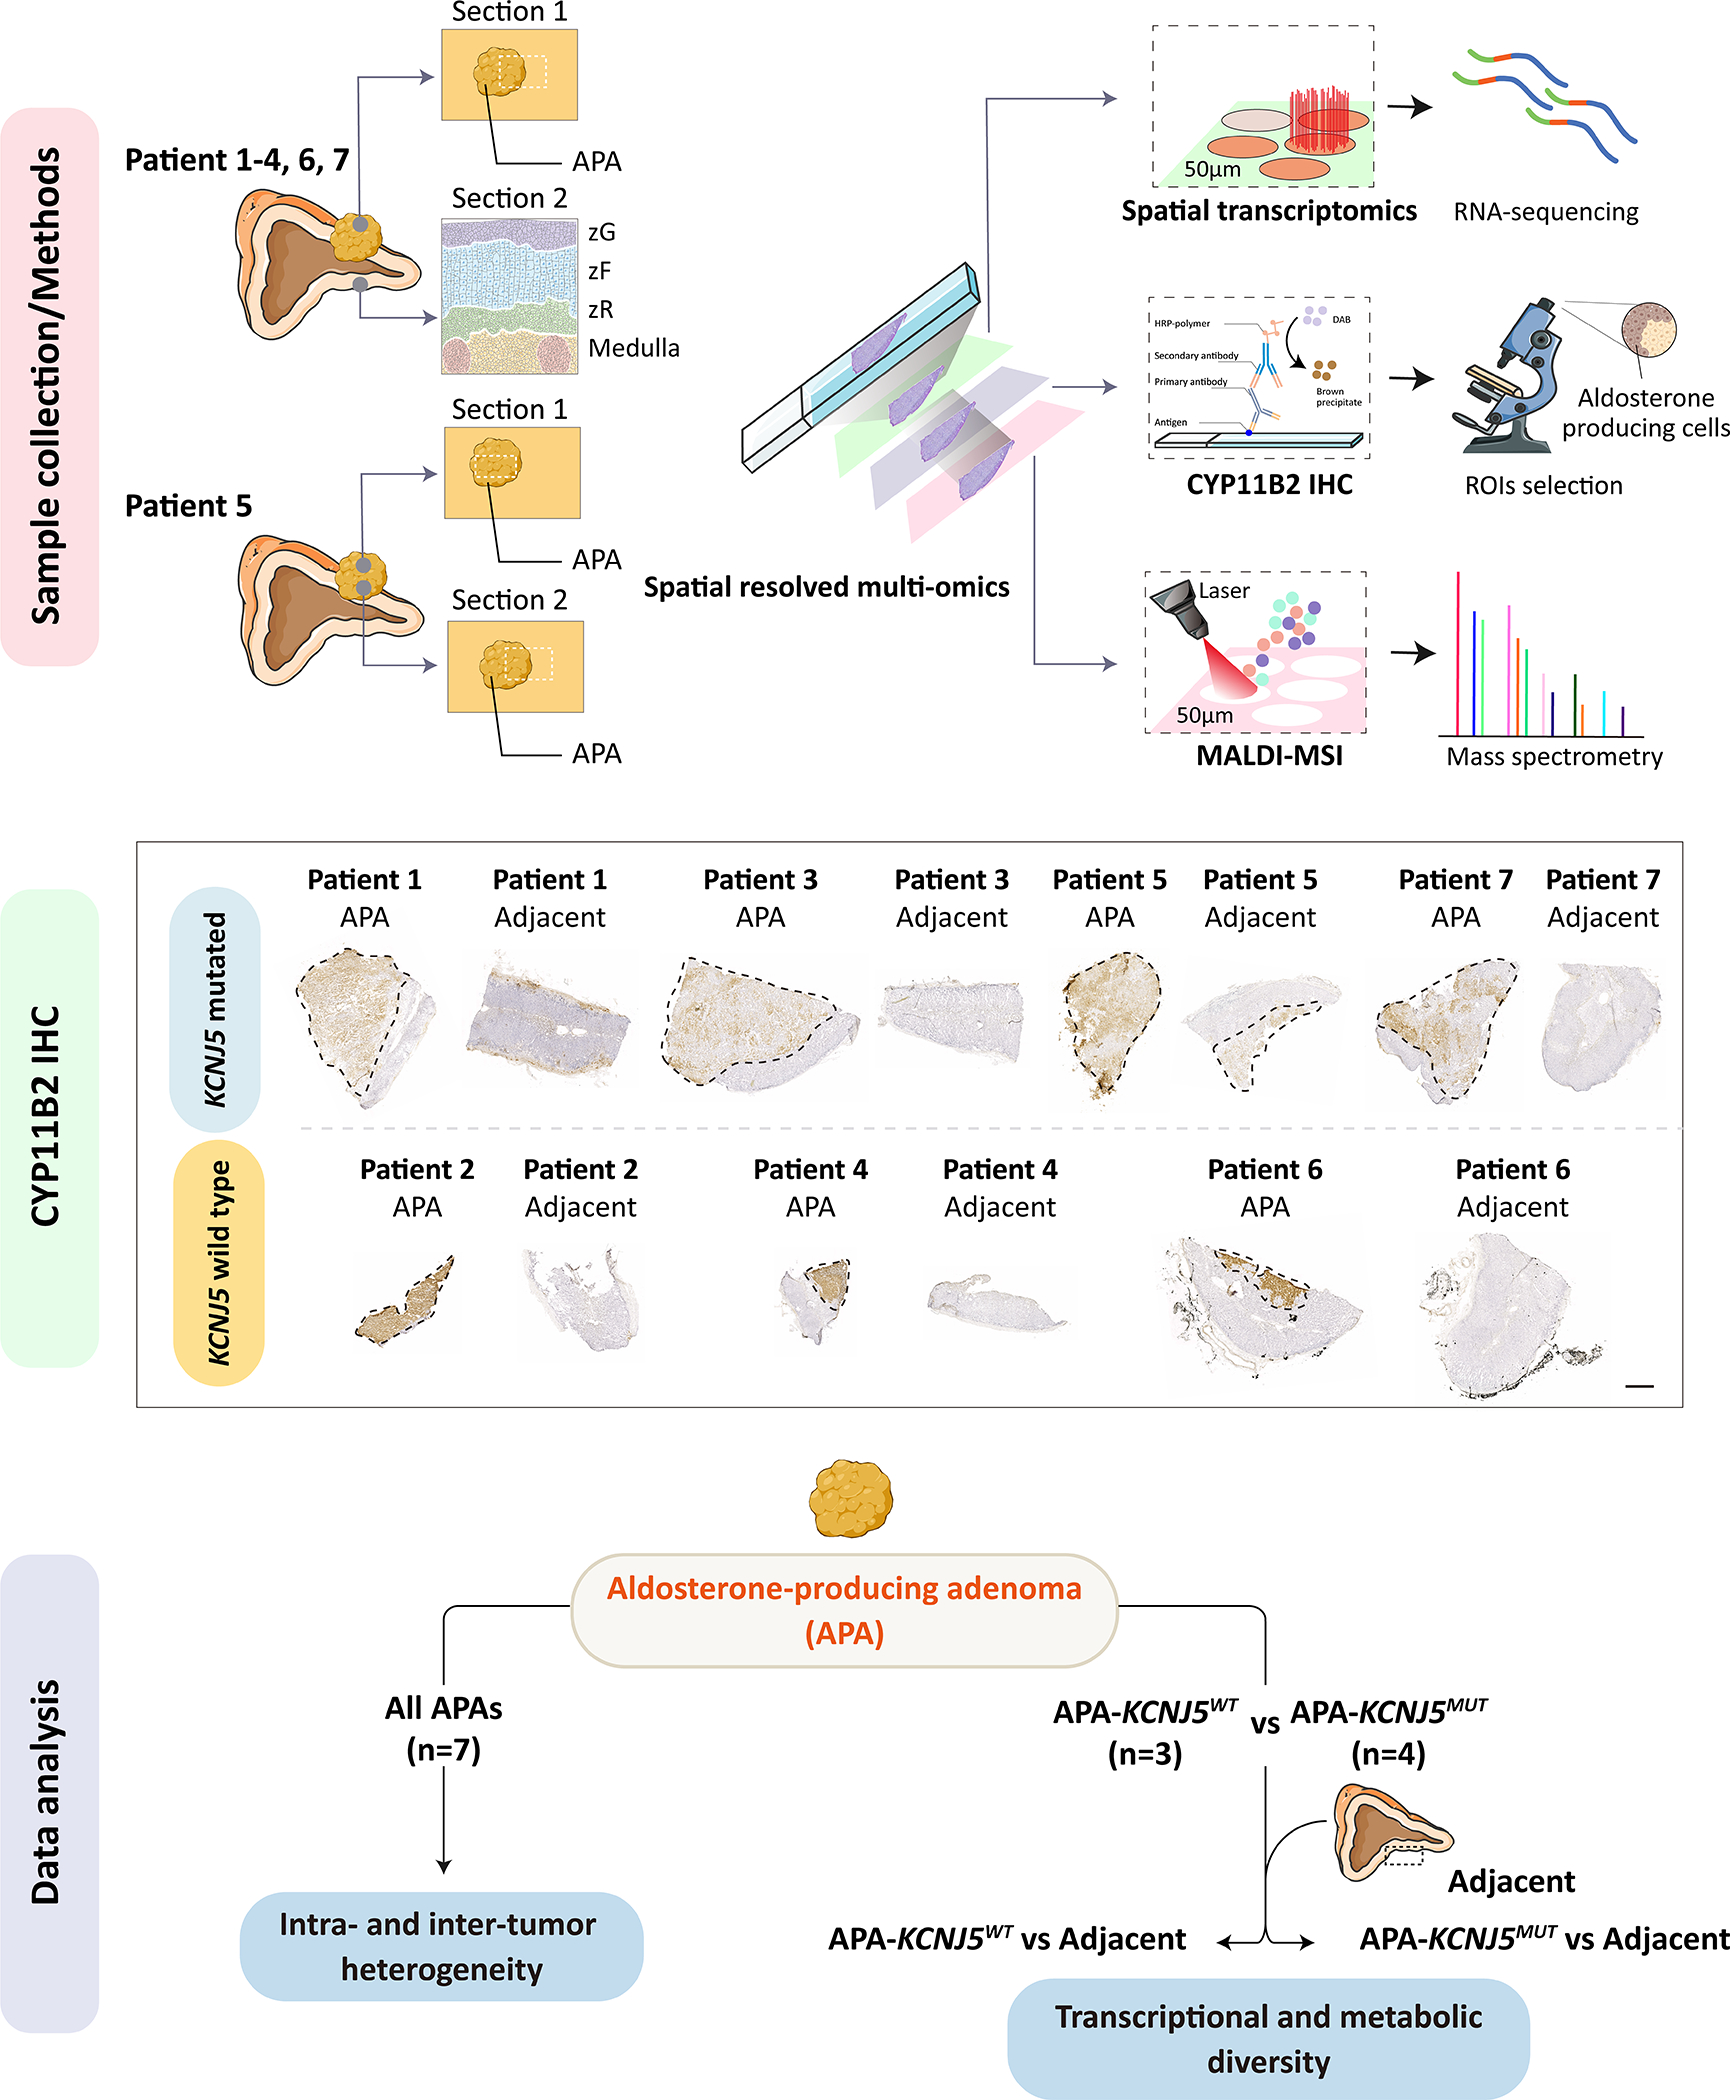
Figure 1. Adrenal tissue sections for spatial multi-omics profiling.

Illustration of adrenal samples used for spatial datasets. For patients 1–4 and 6–7, an adrenal section with an APA (section 1) and a separate section of adjacent adrenal tissue (section 2 showing adrenal zones, zG, zona glomerulosa; zF, zona fasciculata; zR, zona reticularis) was used. For patient 5, section 1 comprised APA tissue only, section 2 encompassed adjacent adrenal and an APA region. Tumor regions are outlined with a black dashed line. An overview of analytical approaches used is also shown (Upper panel). Successive cryosections were processed for spatial transcriptomic (10x Genomics Visium platform), CYP11B2 IHC to identify ROIs (Middle panel, ROIs indicated by dashed lines, scale bar, 1 mm), and MALDI-MSI. An overview of the data analysis strategy is also shown (Bottom panel). IHC, immunohistochemistry; MALDI-MSI, matrix-assisted laser desorption/ionization mass spectrometry imaging; ROIs, regions of interest. Illustration used SMART servier medical art (https://smart.servier.com/).
