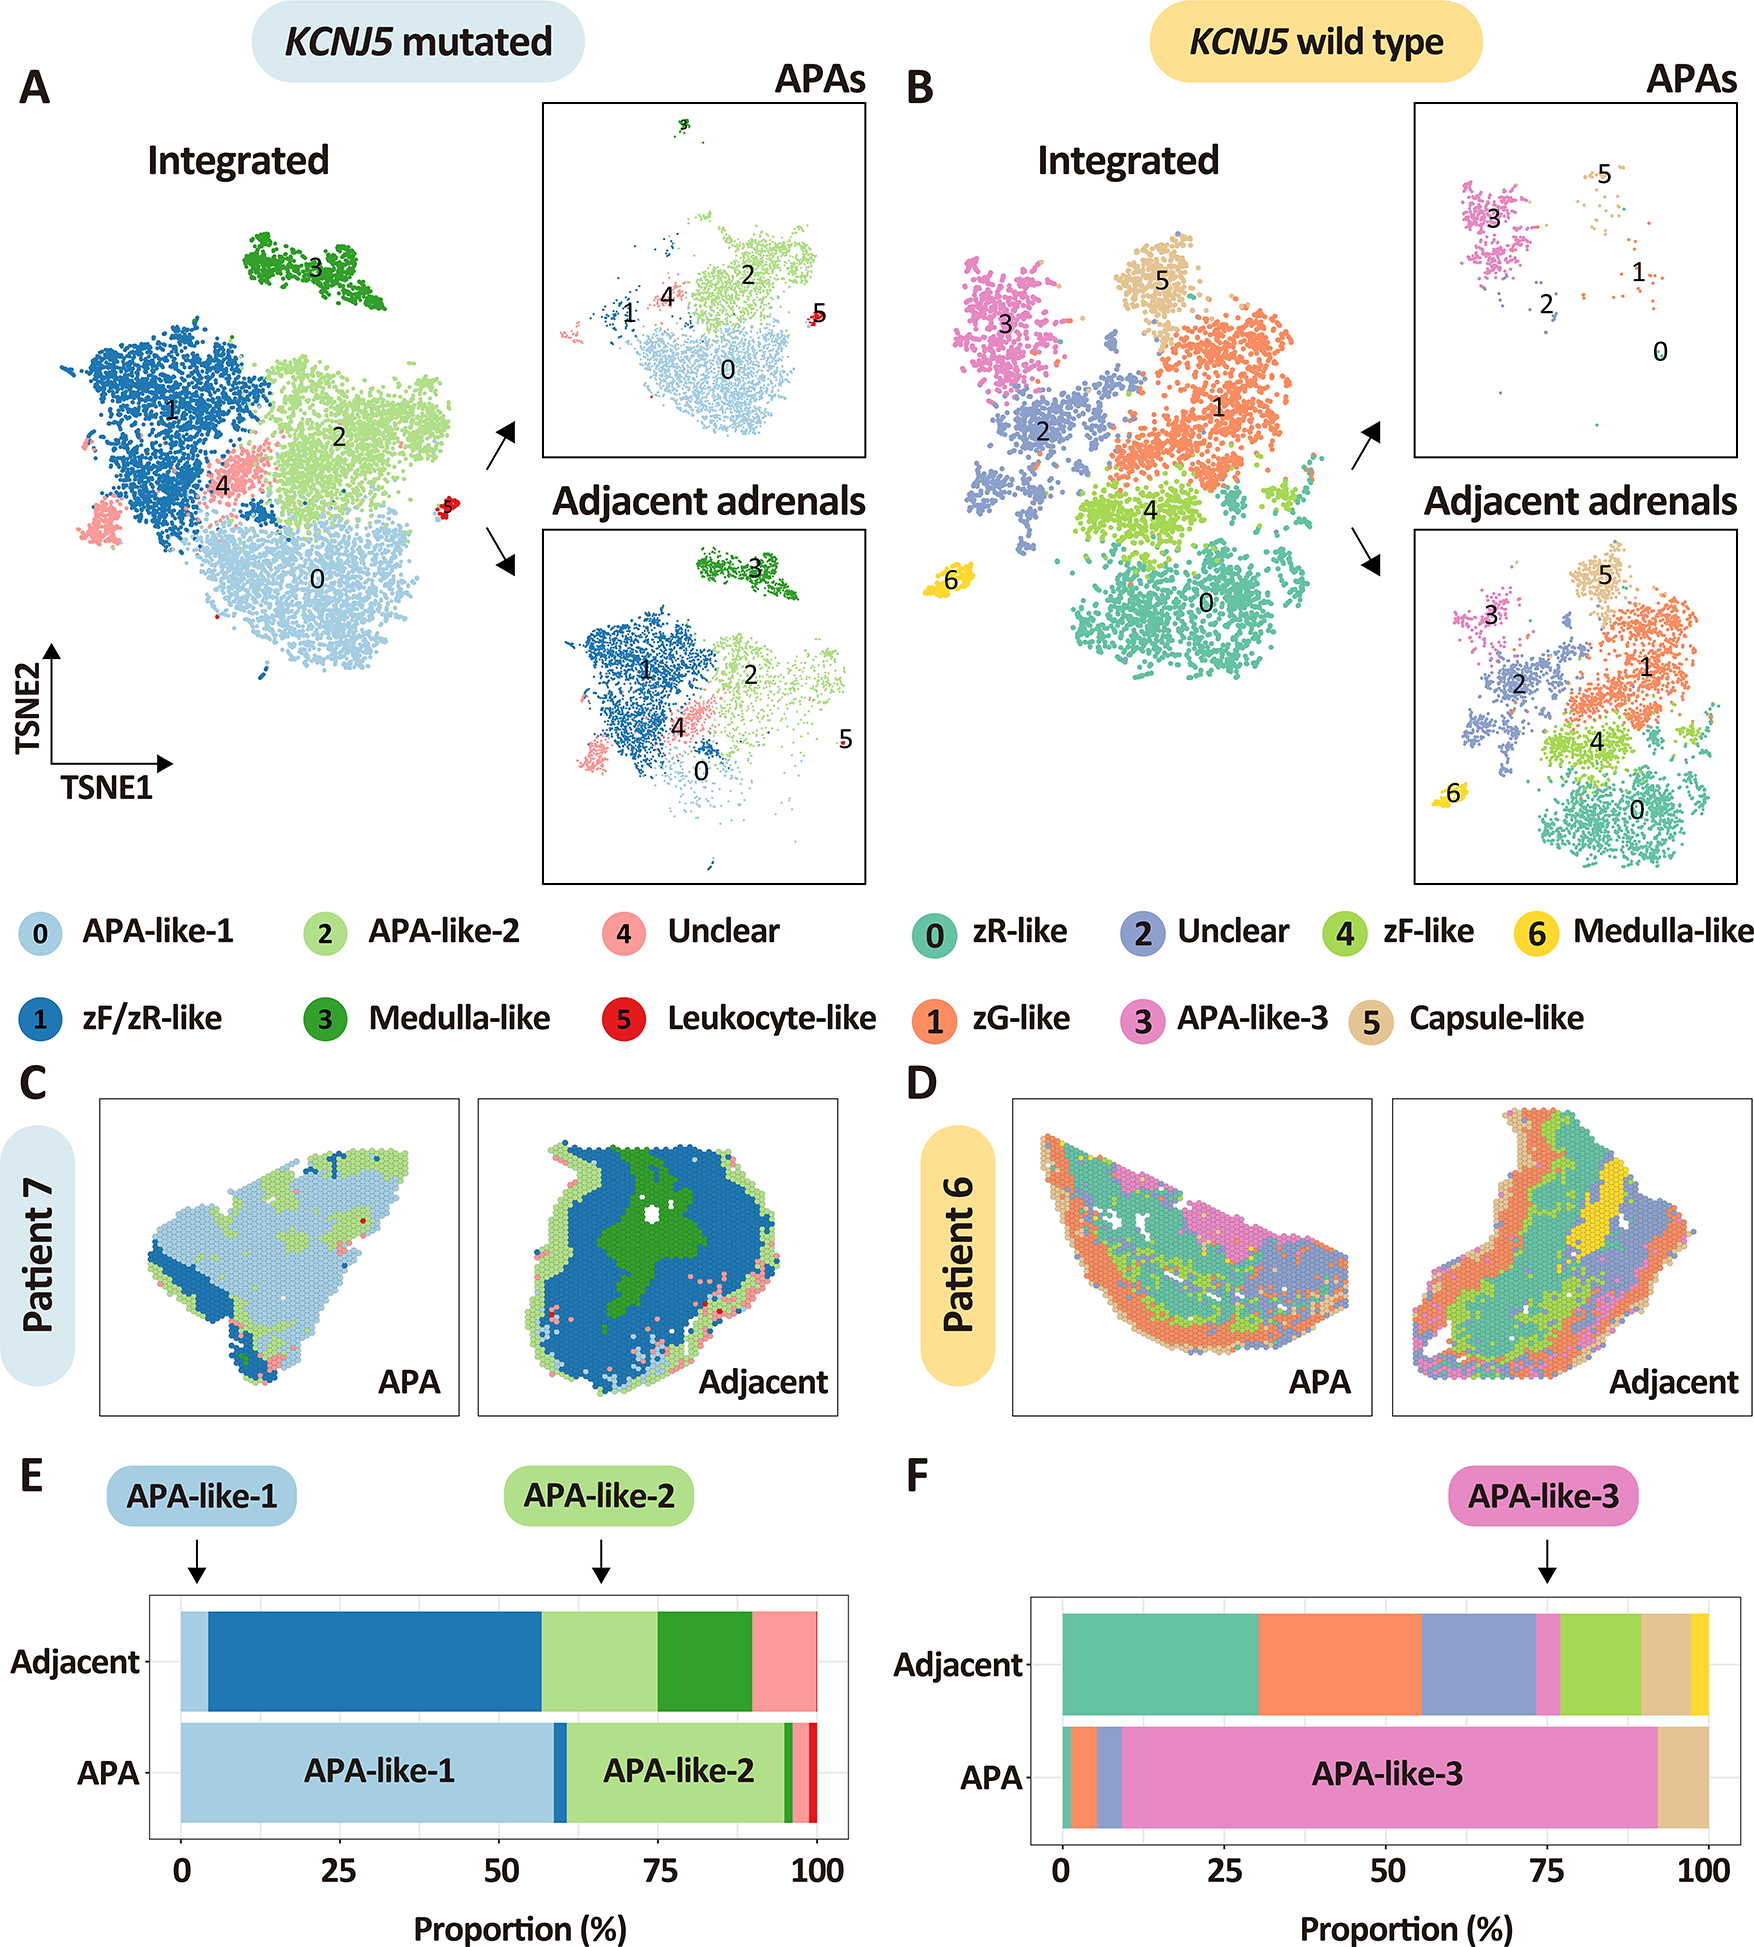
Figure 6. Spatial transcriptomics establishes APA-like subpopulations in the adjacent adrenal cortex.

A-B, t-distributed stochastic neighbor embedding representations of the integrated spatial transcriptomes of APAs and adjacent adrenal tissues stratified by APA-KCNJ5 mutation status and tissue type. Panels A and B show integrated spatial transcriptomic spots from APAs and adjacent adrenal tissues (left image of A and B) as well as separated into APAs (boxed image, top right of A and B) and adjacent adrenal tissues (boxed image, bottom right of A and B). Colors represent transcriptome subpopulations as indicated. A, APA-KCNJ5MUT (n = 4) and their adjacent adrenal cortex (n = 4). B, APA-KCNJ5WT (n = 3) and their adjacent adrenal cortex (n = 3). C-D, representative spatial transcriptomics sections showing the distribution of spots in APAs and adjacent adrenals from patient 7 with a KCNJ5 mutation (male) and patient 6 without a KCNJ5 mutation (female). E-F, stacked plots showing the proportion of each transcriptome cluster in APAs and adjacent adrenals. Left panels and right panels indicate adrenal tissues from patients with a KCNJ5 mutation (represented in light blue, Left,) or without a KCNJ5 mutation (represented in light yellow, Right). All APA-like signatures (APA-like 1, 2 and 3) are common to tumor areas and adjacent tissue and may represent precursor APA subpopulations.
