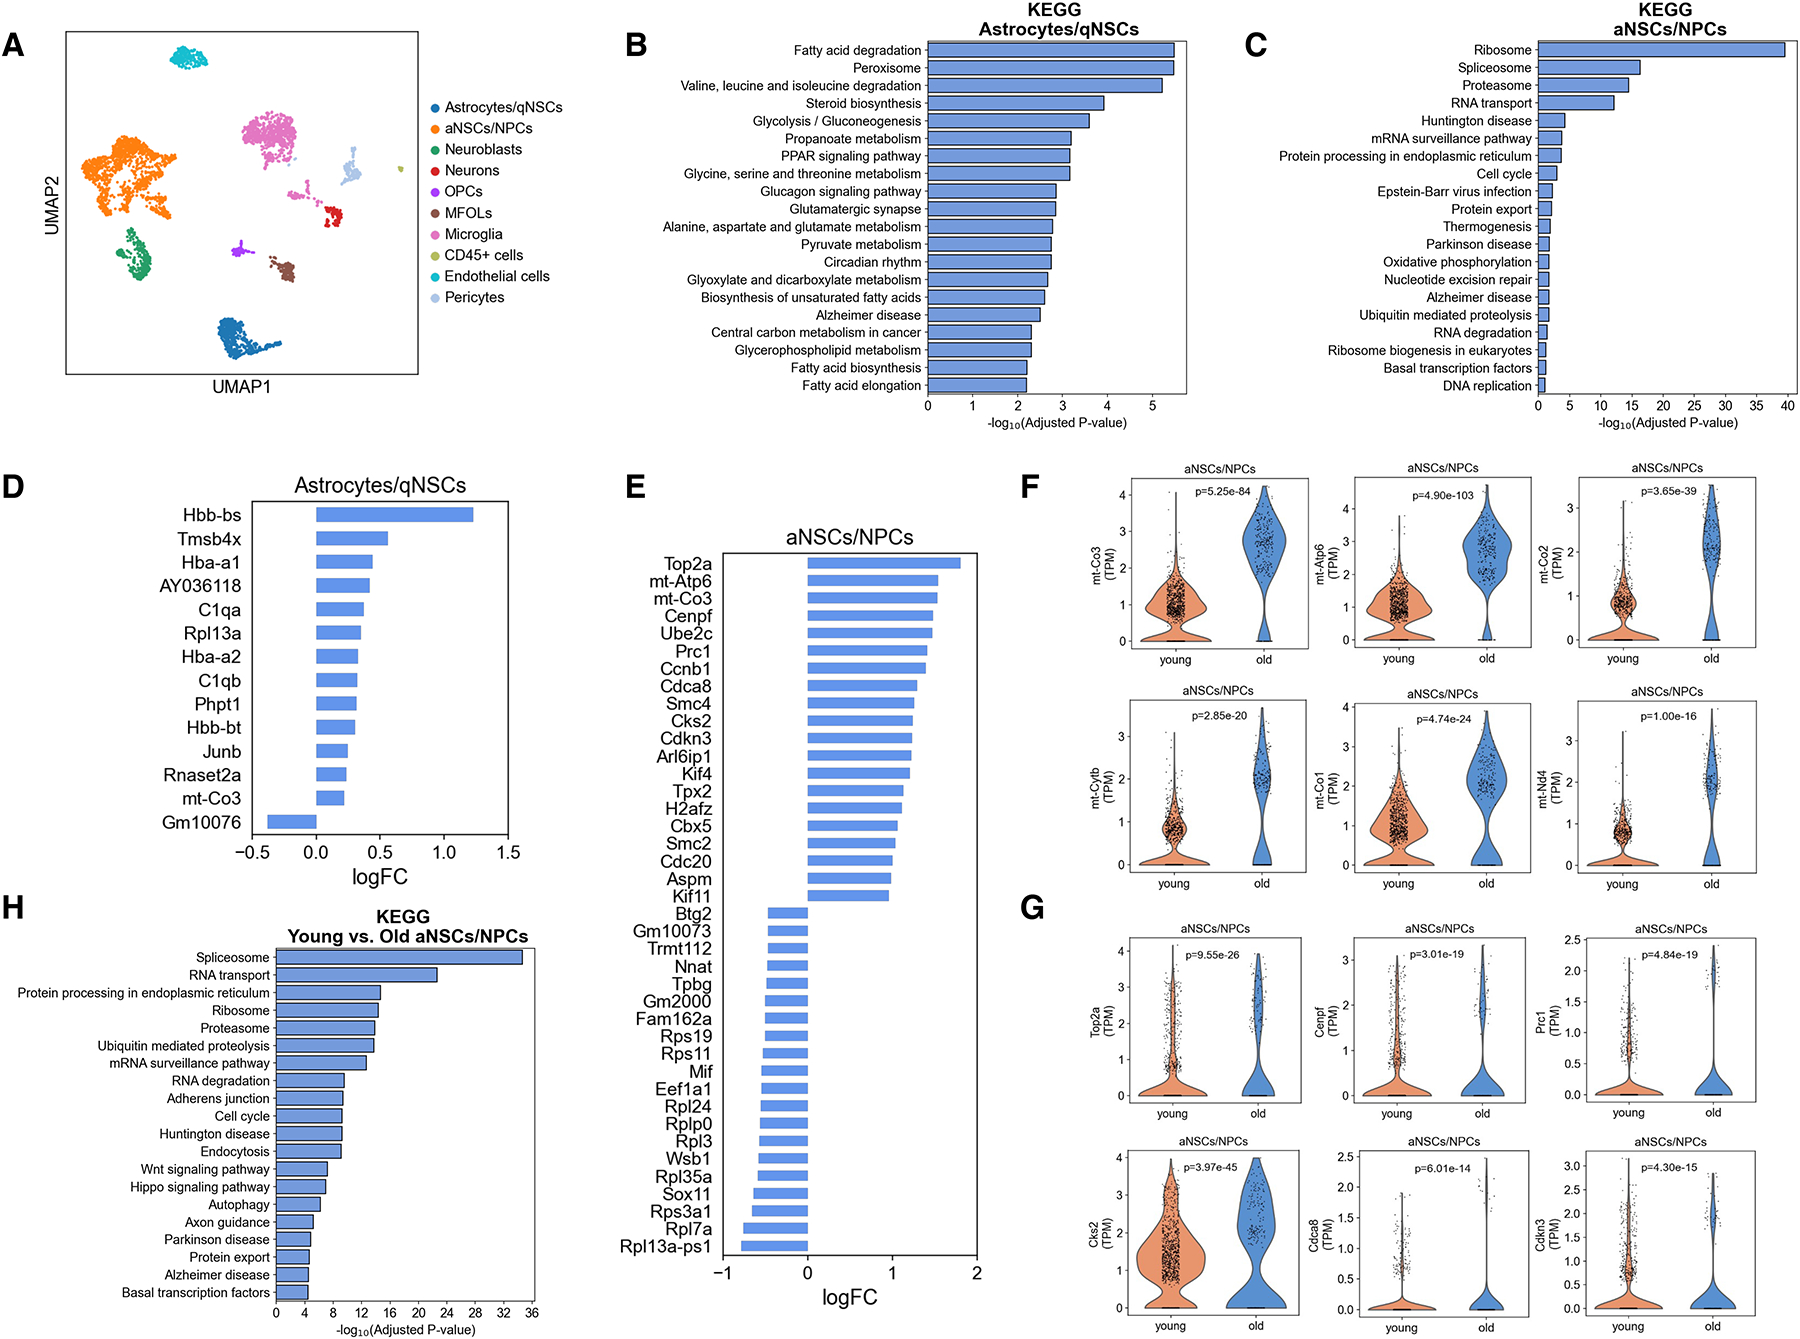
Figure 1.

Aging results in increased mitochondrial and cell cycle gene expression in activated NSCs/NPCs of the dentate gyrus.
A, Single-cell RNA-sequencing of the dentate gyrus of young (3 months old) and old (16 months old) male mice using the 10x Genomics Chromium platform. UMAP clustering of single cell transcriptomes (2463 cells from young and 1430 cells from old) colored by cell type (qNSCs: quiescent neural stem cells, aNSCs: activated neural stem cells, NPCs: neural progenitor cells, OPCs: oligodendrocyte progenitor cells, MFOLs: myelin-forming oligodendrocytes, and CD45+ cells: hematopoietic cells). n=4 mice/age.
B, C, Pathway analysis for the biological functions of cluster-specific genes for astrocytes/quiescent NSCs (B) and activated NSCs/NPCs (C).
D, E, Top 20 upregulated and top 20 downregulated genes in astrocytes/quiescent NSCs (D) and activated NSCs/NPCs (E) with age computed using MAST. Genes were classified as significant with a false-discovery rate less than 0.05. FC: fold change.
F, Violin plots showing the expression of representative mitochondrial genes in activated NSCs/NPCs of the dentate gyrus of young (3 months old) and old (16 months old) mice. Each dot represents the gene expression levels in one cell. n=4 mice/age. Wilcoxon rank-sum test.
G, Violin plots showing the expression of representative cell cycle genes in activated NSCs/NPCs of the dentate gyrus of young (3 months old) and old (16 months old) mice. Each dot represents the gene expression levels in one cell. n=4 mice/age. P values are false discovery rate-corrected, MAST differential expression test.
H, Pathway analysis for the biological functions of differentially expressed genes in activated NSCs/NPCs in the dentate gyrus of young (3 months old) and old (16 months old) mice.
