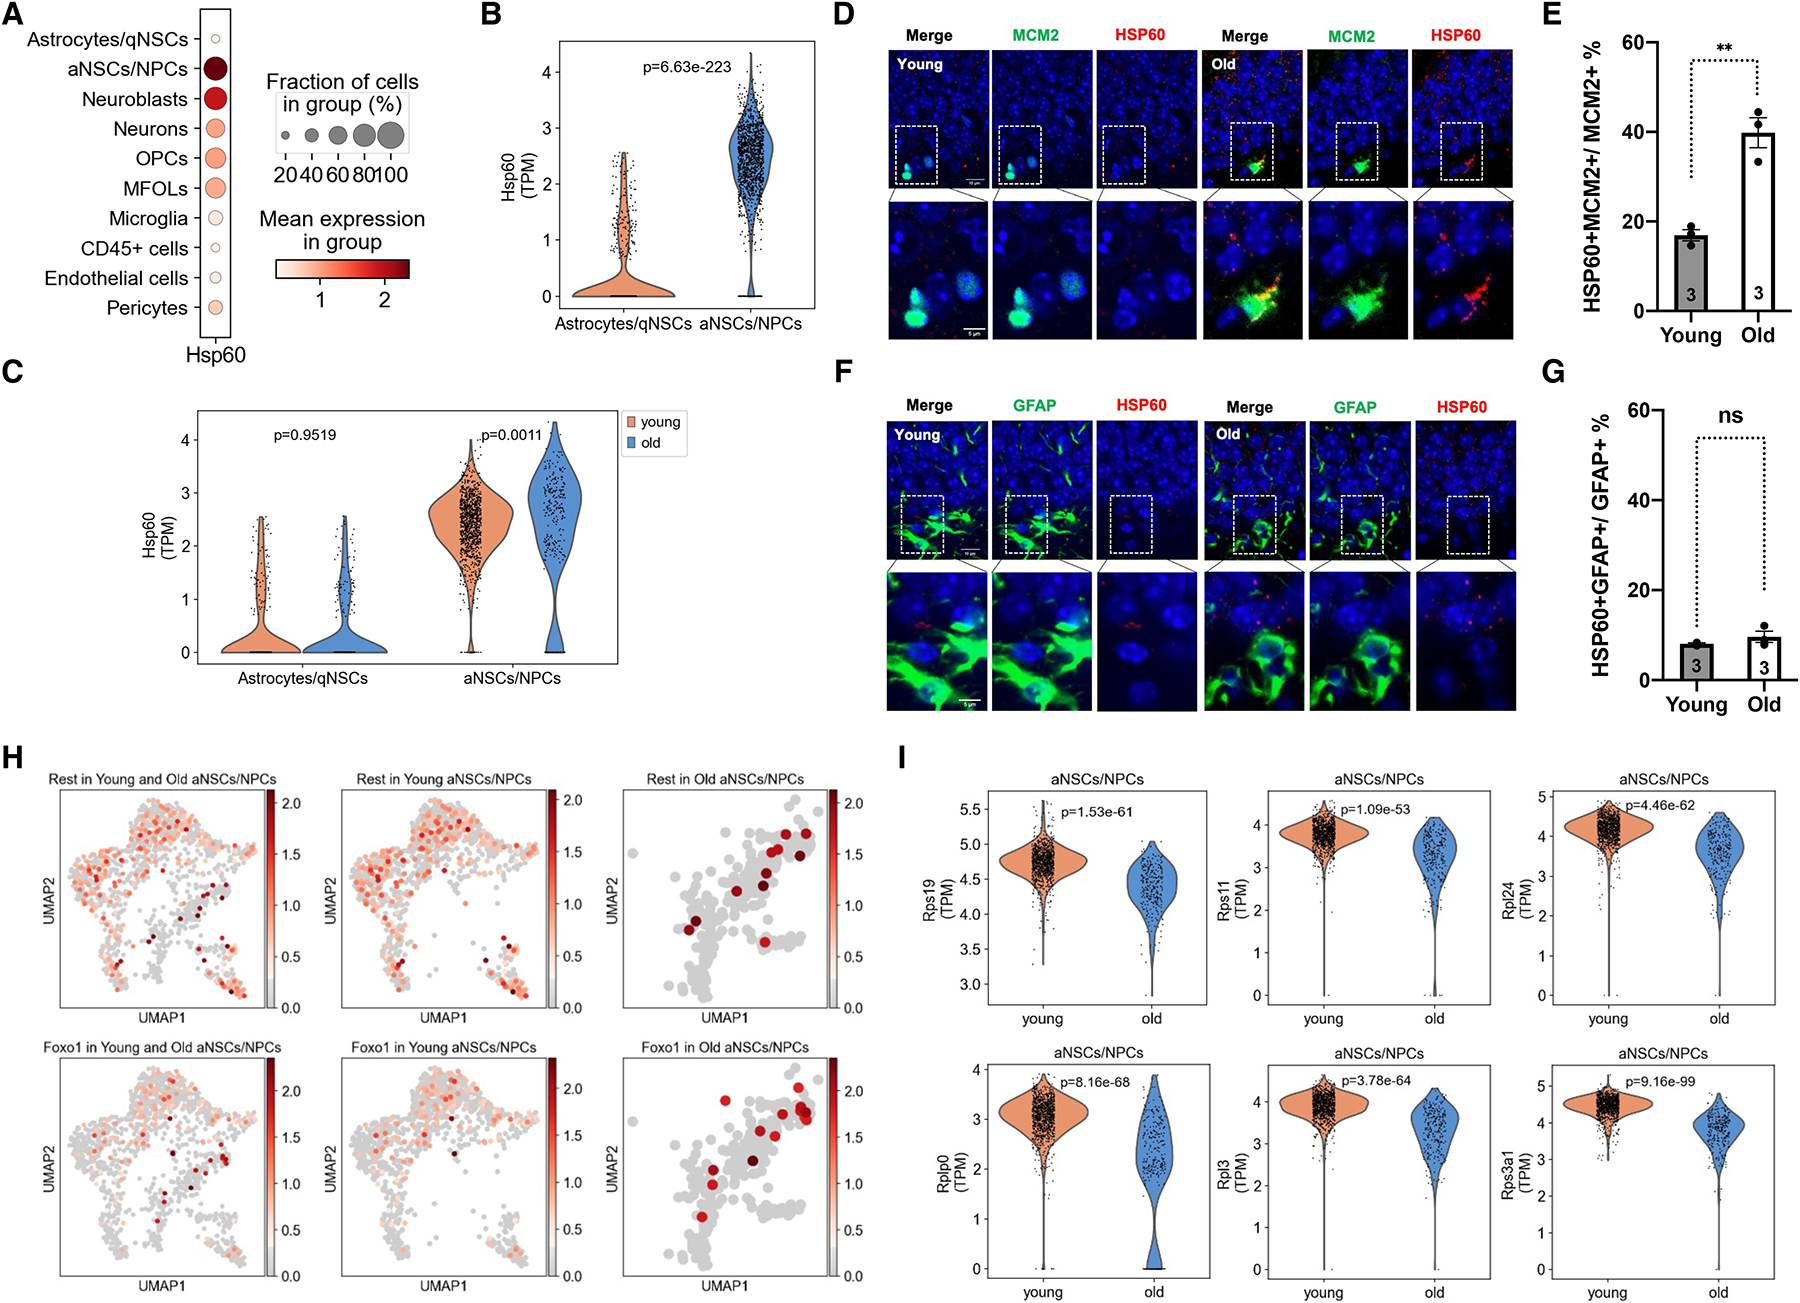
Figure 2.

Increased mitochondrial protein folding stress during NSC activation and aging in the dentate gyrus.
A, Dot plot showing proportion of cells positive for HSP60 and log-normalized expression values of HSP60 in the cell clusters as indicated.
B, C, Violin plots comparing log-normalized expression values of HSP60 in astrocytes/quiescent NSCs and activated NSCs/NPCs of young mice (B) and astrocytes/quiescent NSCs and activated NSCs/NPCs of young and old mice (C). Each dot represents the gene expression levels in one cell. Wilcoxon rank-sum test.
D-G, Immunohistochemistry staining and quantification for HSP60 and MCM2 (D, E) and HSP60 and GFAP (F, G) in the dentate gyrus of young and old mice. Blue: DAPI. Red: HSP60. Green: MCM2 or GFAP. Scale bar: 10 μm (top). 5 μm (bottom). Error bars represent SE. **: p < 0.01. ns: p>0.05. Student’s t test.
H, UMAP plots showing the expression of Rest and Foxo1 in activated NSCs/NPCs of the dentate gyrus of young (3 months old) and old (16 months old) mice. Each dot represents the gene expression levels in one cell. n=4 mice/age.
I, Violin plots showing the differential expression of representative ribosomal proteins in activated NSCs/NPCs of the dentate gyrus of young (3 months old) and old (16 months old) mice. Each dot represents the gene expression levels in one cell. n=4 mice/age. Wilcoxon rank-sum test.
