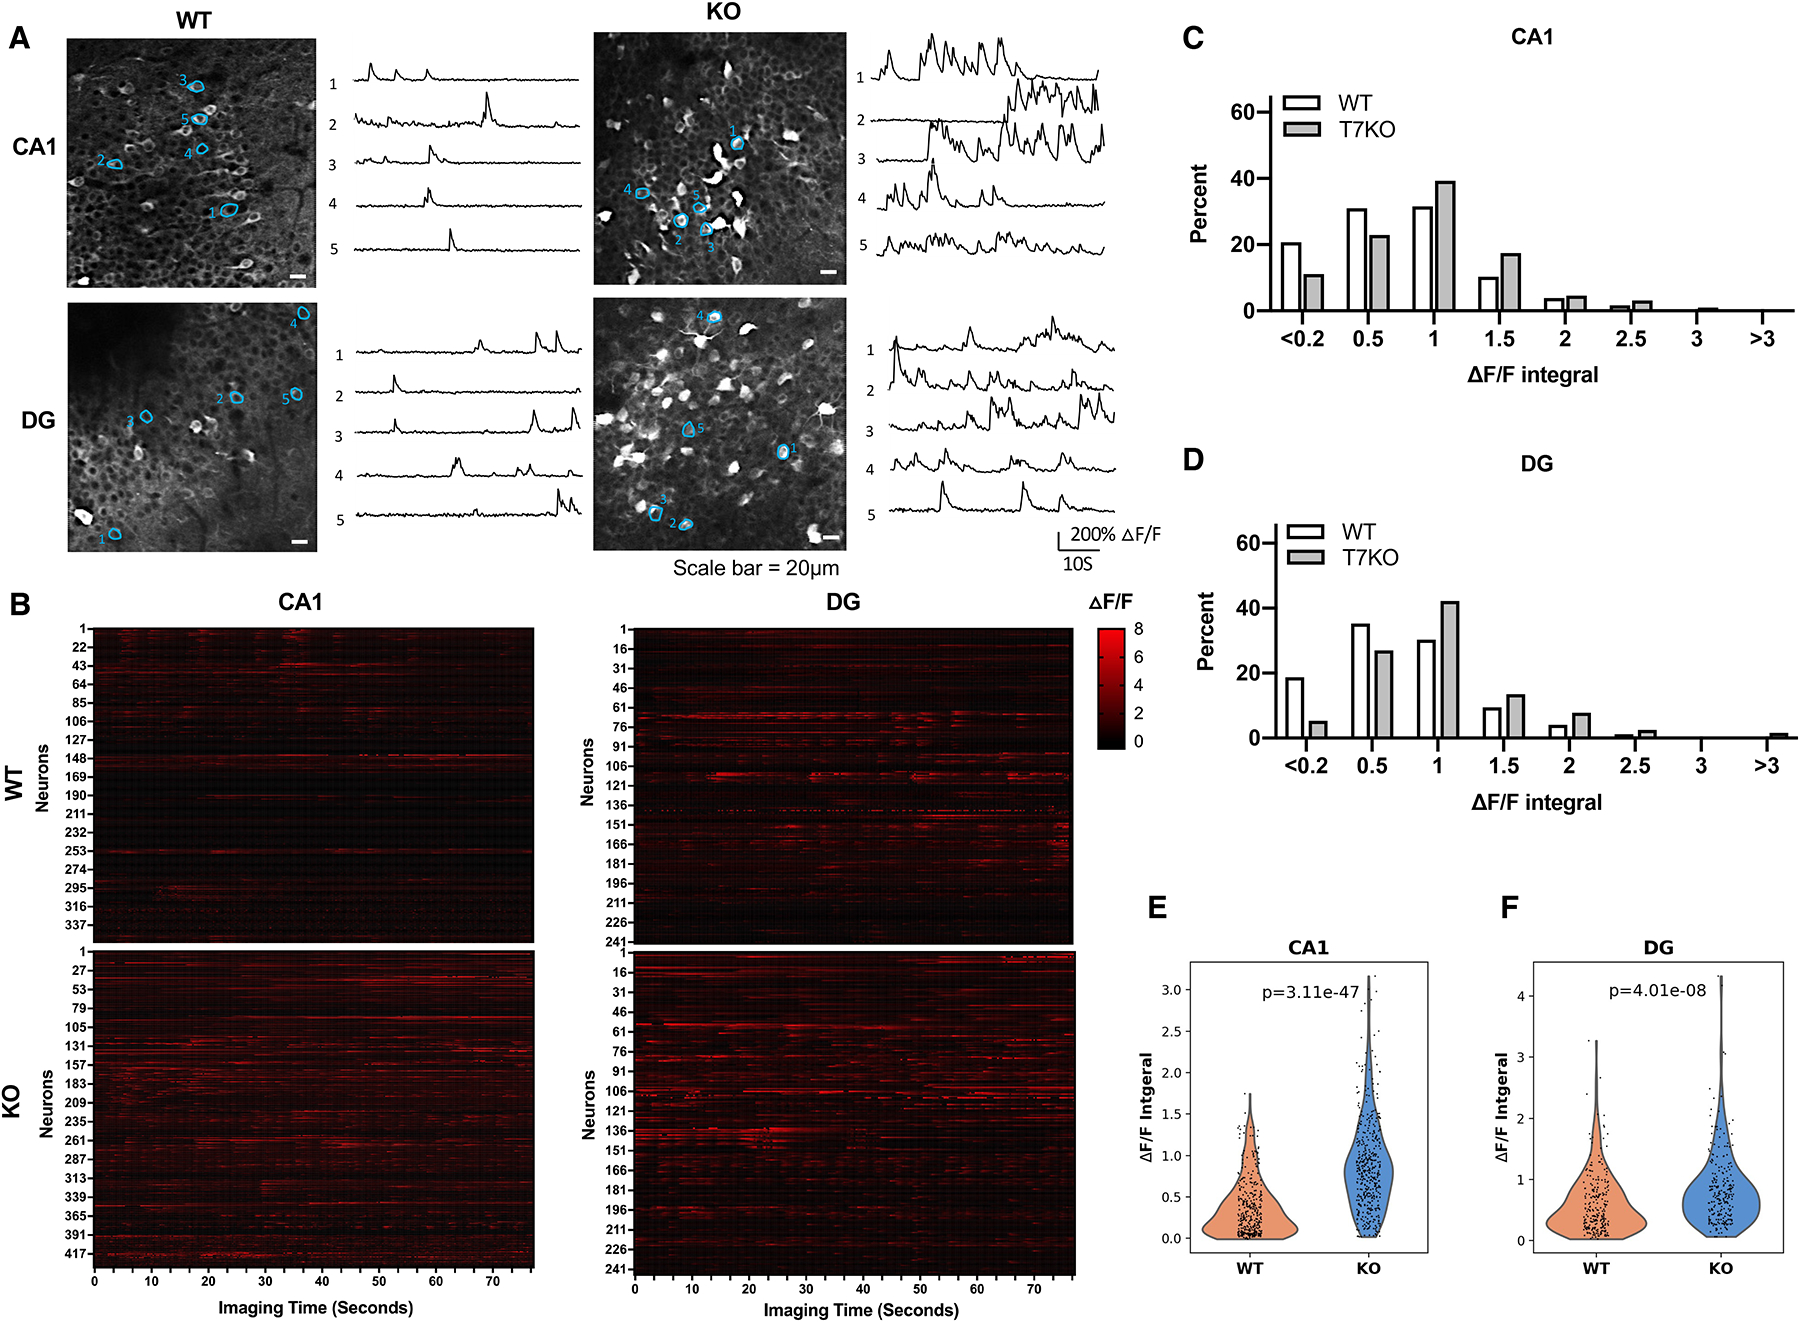
Figure 5.

SIRT7 suppresses neural hyperactivity.
A-F, 4–6-month-old WT and SIRT7−/− mice were subjected to stereotaxic injection in the dorsal dentate gyrus and CA1 with AAV1 expressing GCaMP6s and installation of a cranial window, and visualized using two-photon imaging. Data shown are GCaMP6s fluorescence images and ΔF/F calcium transient traces of neurons (scale bar=20 μm) (A), raster plots of ΔF/F from all identified neurons (B), histogram distributions of neural activity (quantified as integral of ΔF/F traces) (C, D), and violin plots of neural activity (Wilcoxon rank-sum test) (E, F) of indicated brain regions. (CA1, n= 356 cells of 19 imaging areas of five WT mice and n=434 cells of 21 imaging areas of four SIRT7−/− mice; dentate gyrus, n=241 cells of 15 imaging areas of four WT mice and n=244 cells of 15 imaging areas of four SIRT7−/− mice). See also Figure S12.
