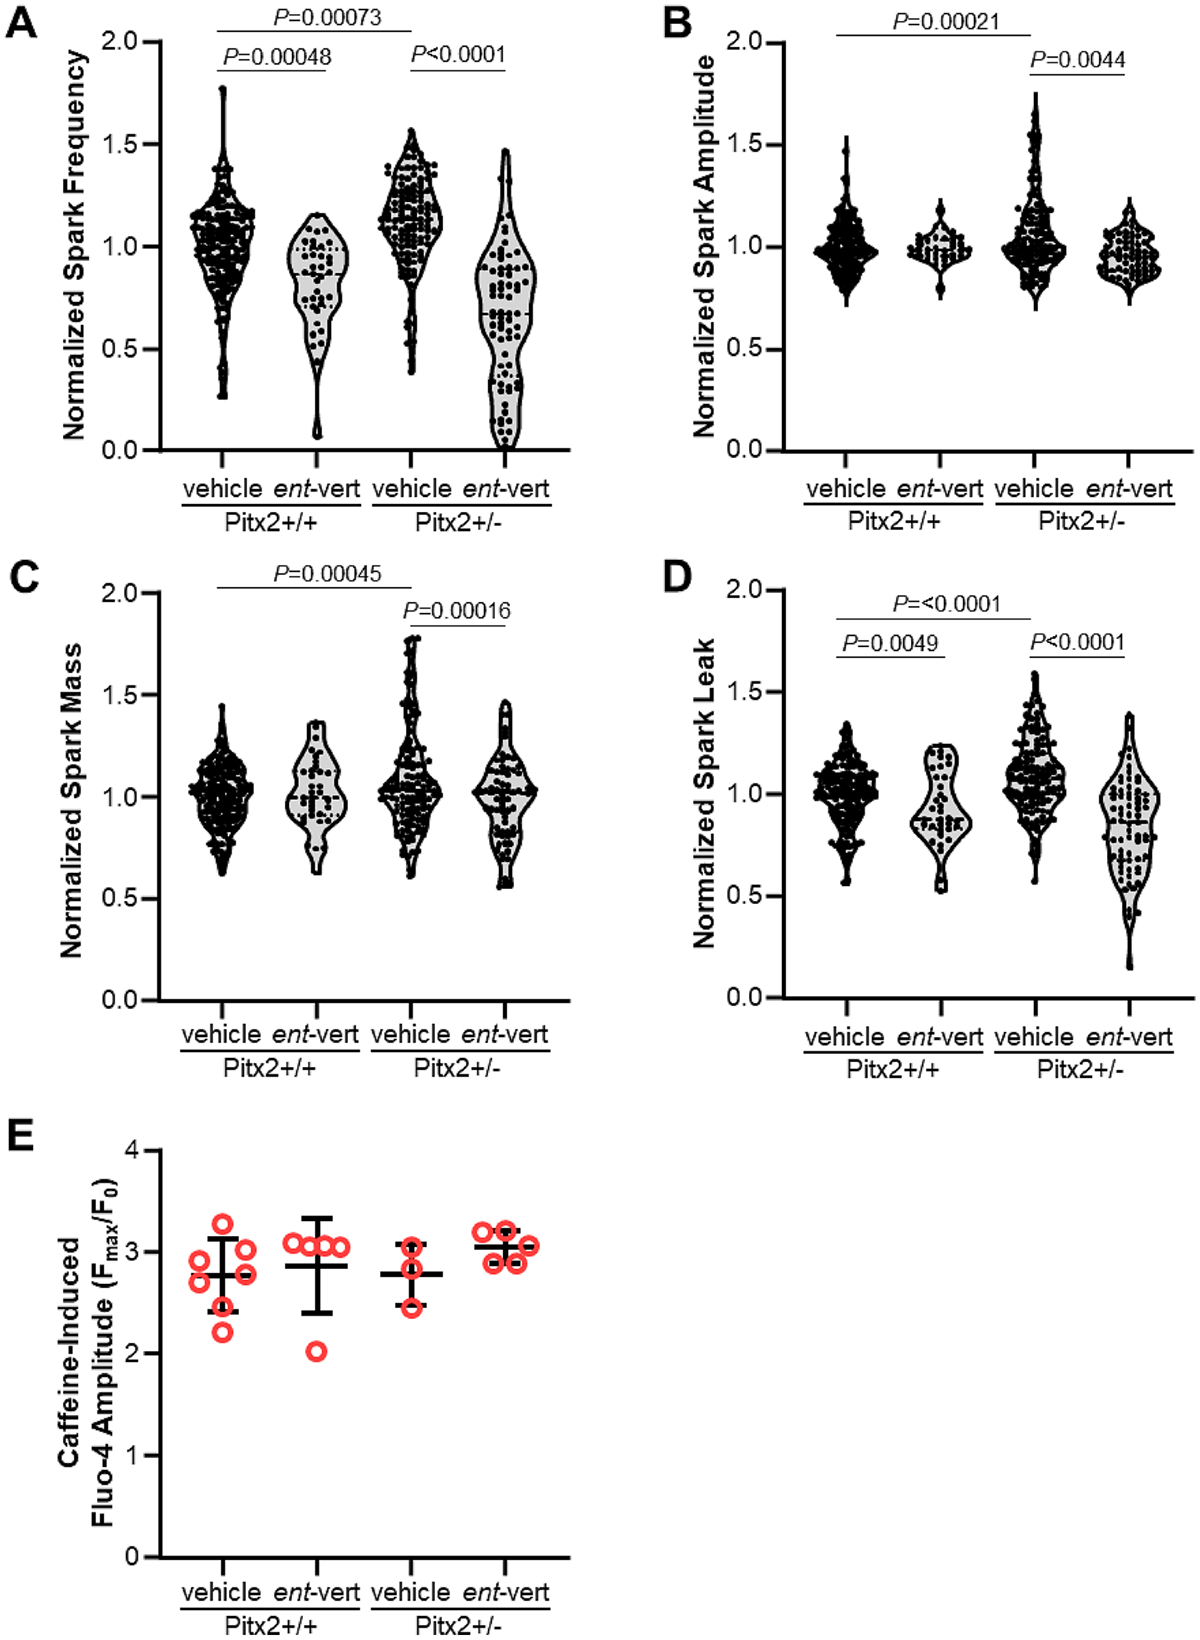
Figure 1. Ca2+ spark properties in permeabilized atrial cardiomyocytes.

(A) Ca2+ spark frequency, (B) amplitude, (C) mass, and (D) leak. Figure panels shown with full range of values and a box bounding the 25th and 75th percentiles with median. N: Pitx2+/+ (vehicle) = 168 cells from 6 mice; Pitx2+/+ (ent-vert) = 36 cells from 2 mice; Pitx2+/− (vehicle) = 127 cells from 6 mice; Pitx2+/− (ent-vert) = 70 cells from 4 mice normalized to values from +/+ mice by day of experiment. Bonferroni-adjusted P values calculated using hierarchical clustering. (E) SR load measured by caffeine-induced Ca2+ transient amplitude. Individual values with mean ± SD.
