
Figure 2.
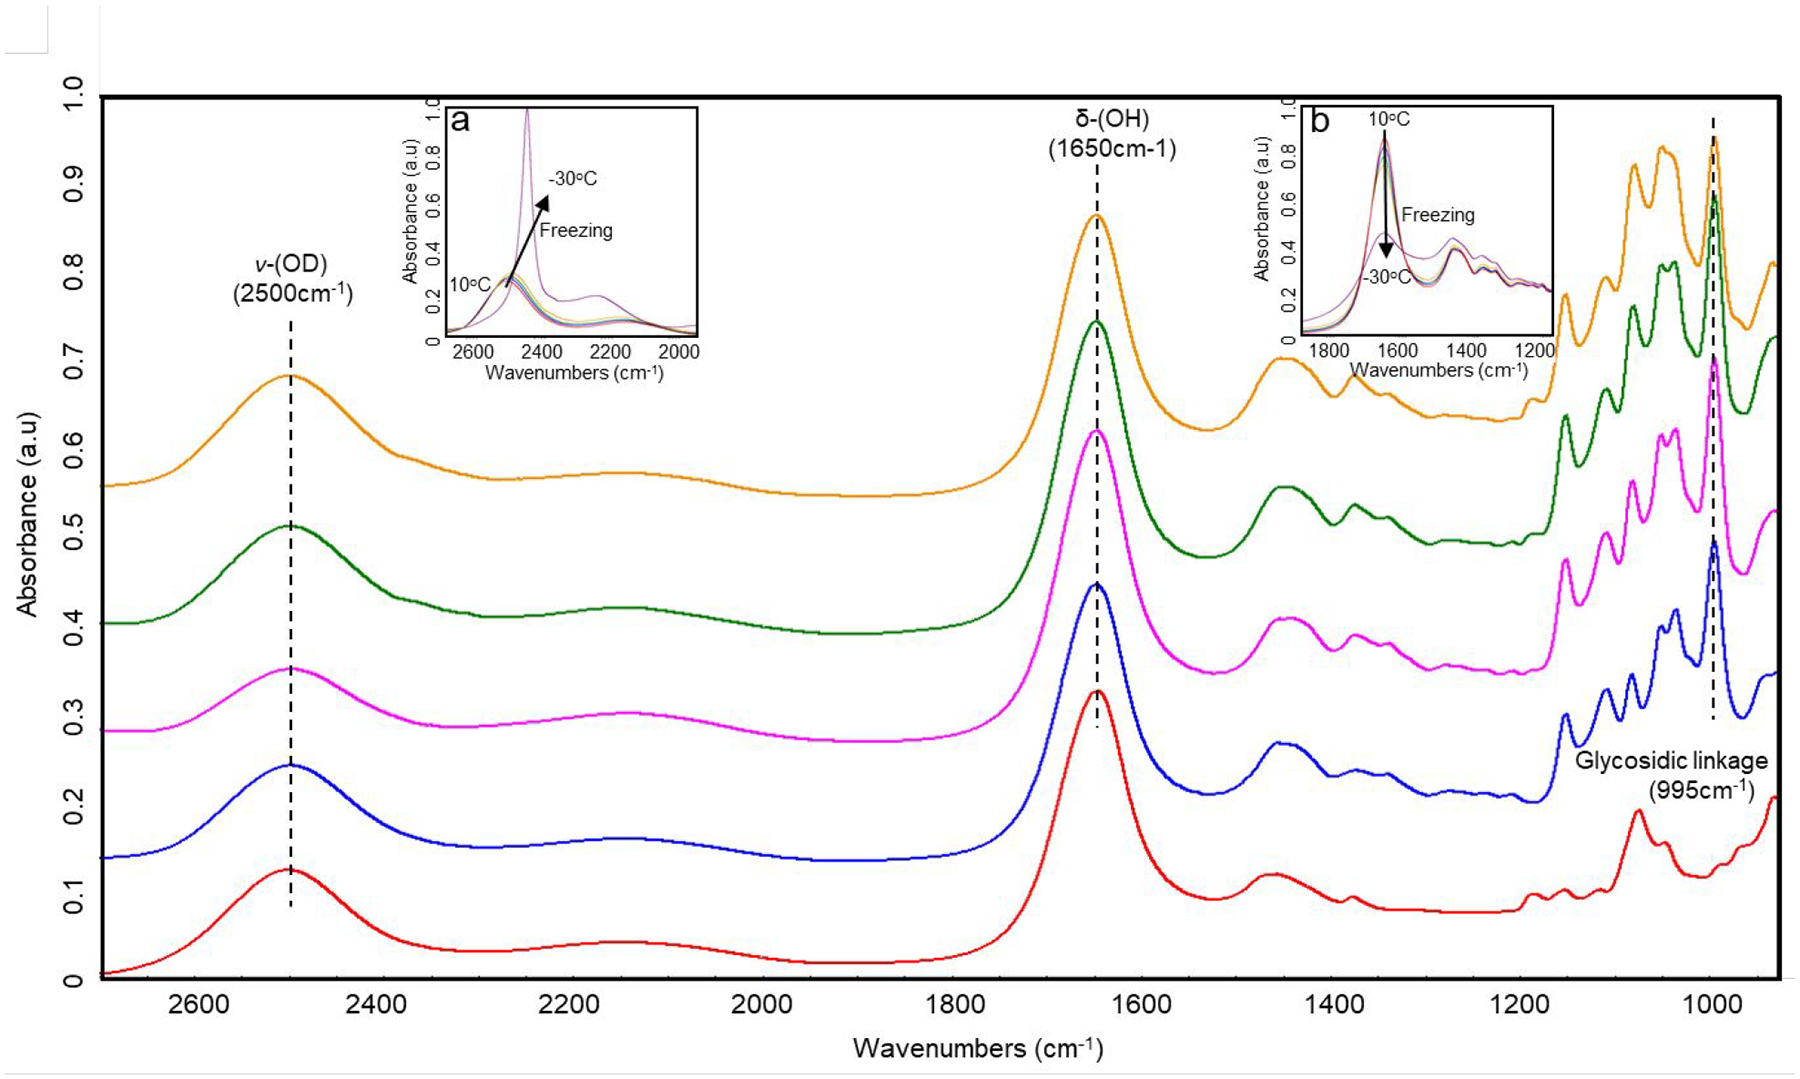
Representative IR spectra of 2.5% agarose (red), 20% trehalose (blue), 0.75% agarose with 20% trehalose (purple), 2.5% agarose with 20% trehalose (green), and 4% agarose with 20% trehalose (orange) at 10°C. All samples included 5% D2O.
Official websites use .gov
A
.gov website belongs to an official
government organization in the United States.
Secure .gov websites use HTTPS
A lock (
) or https:// means you've safely
connected to the .gov website. Share sensitive
information only on official, secure websites.
Representative IR spectra of 2.5% agarose (red), 20% trehalose (blue), 0.75% agarose with 20% trehalose (purple), 2.5% agarose with 20% trehalose (green), and 4% agarose with 20% trehalose (orange) at 10°C. All samples included 5% D2O.