Figure 2.
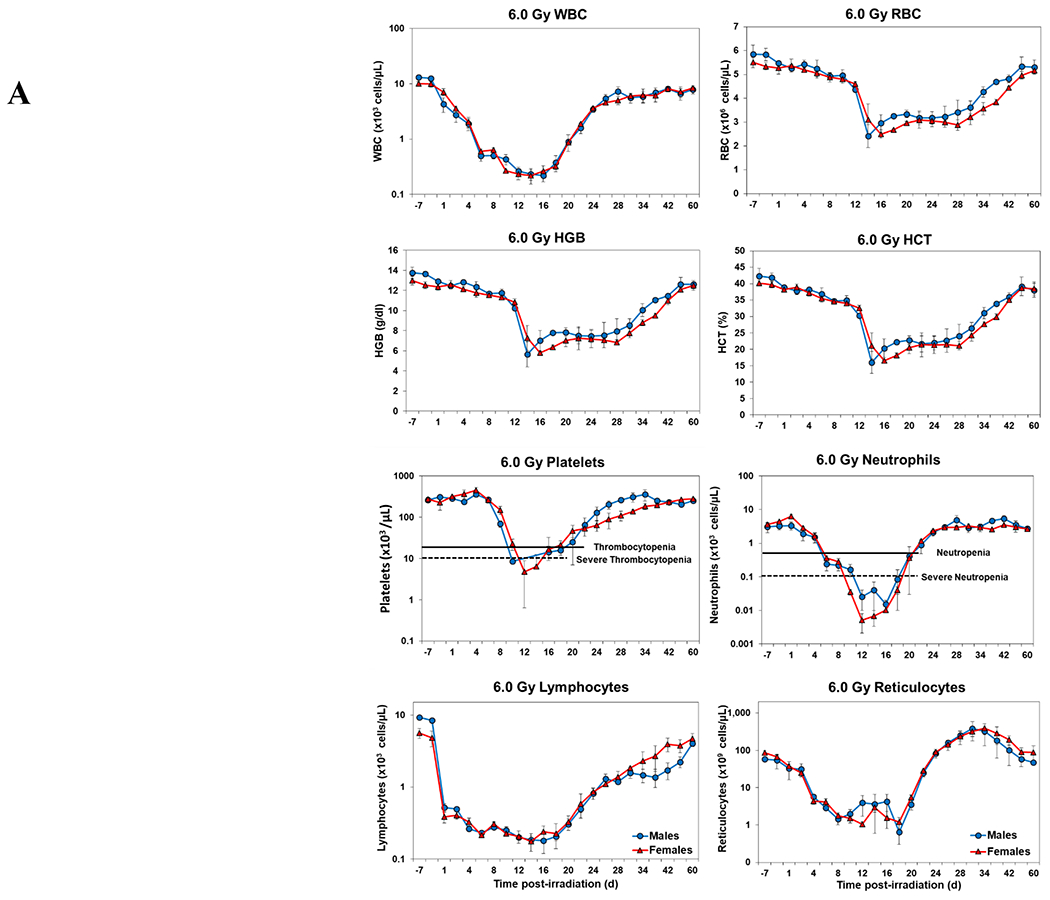
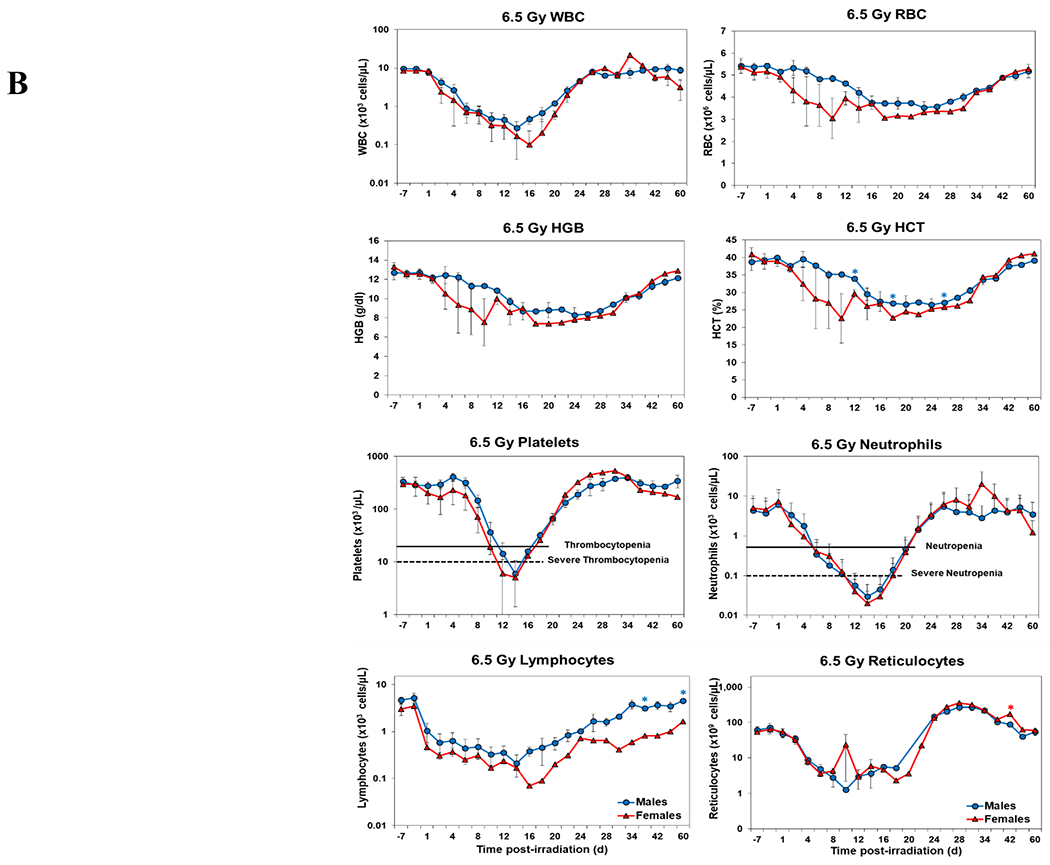
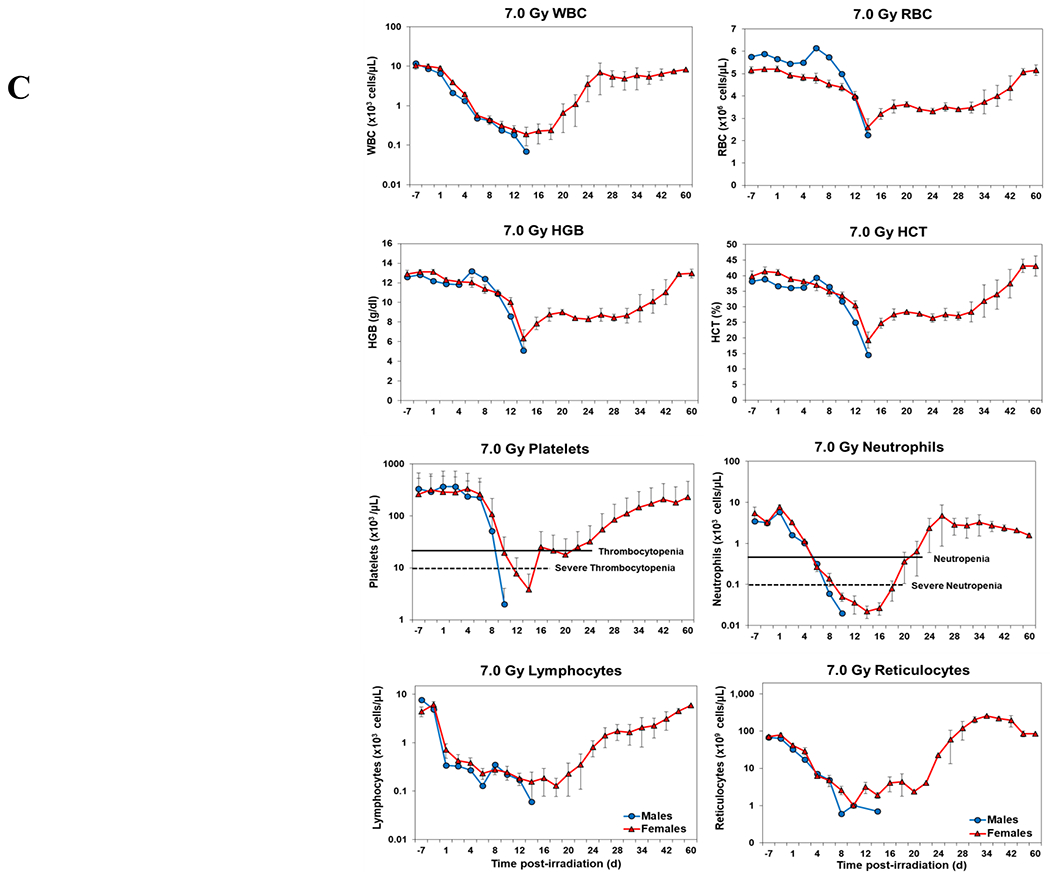
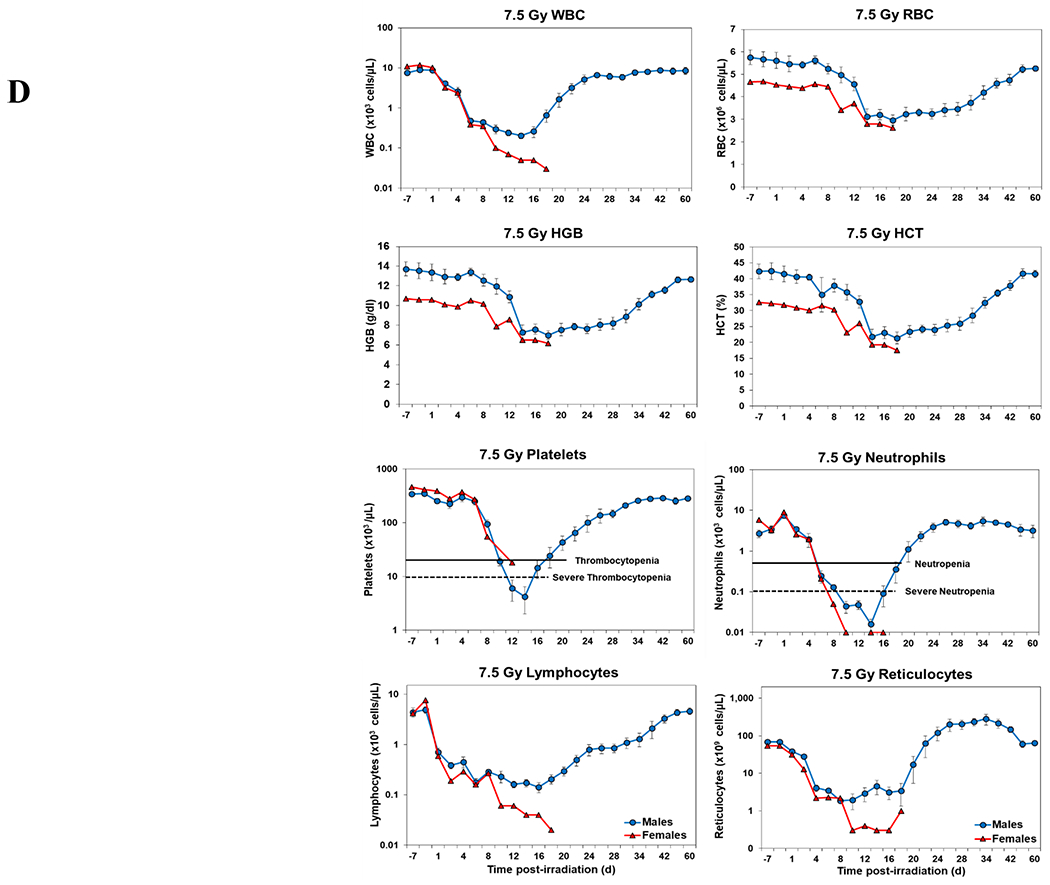
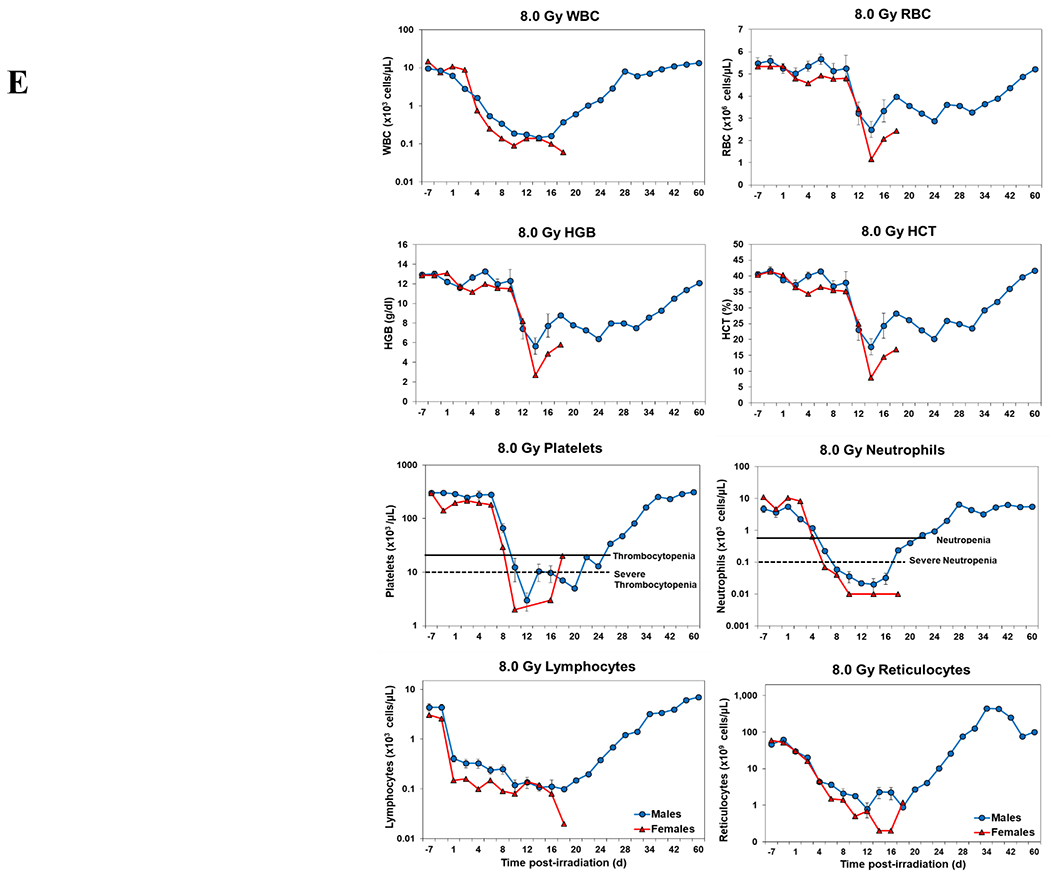
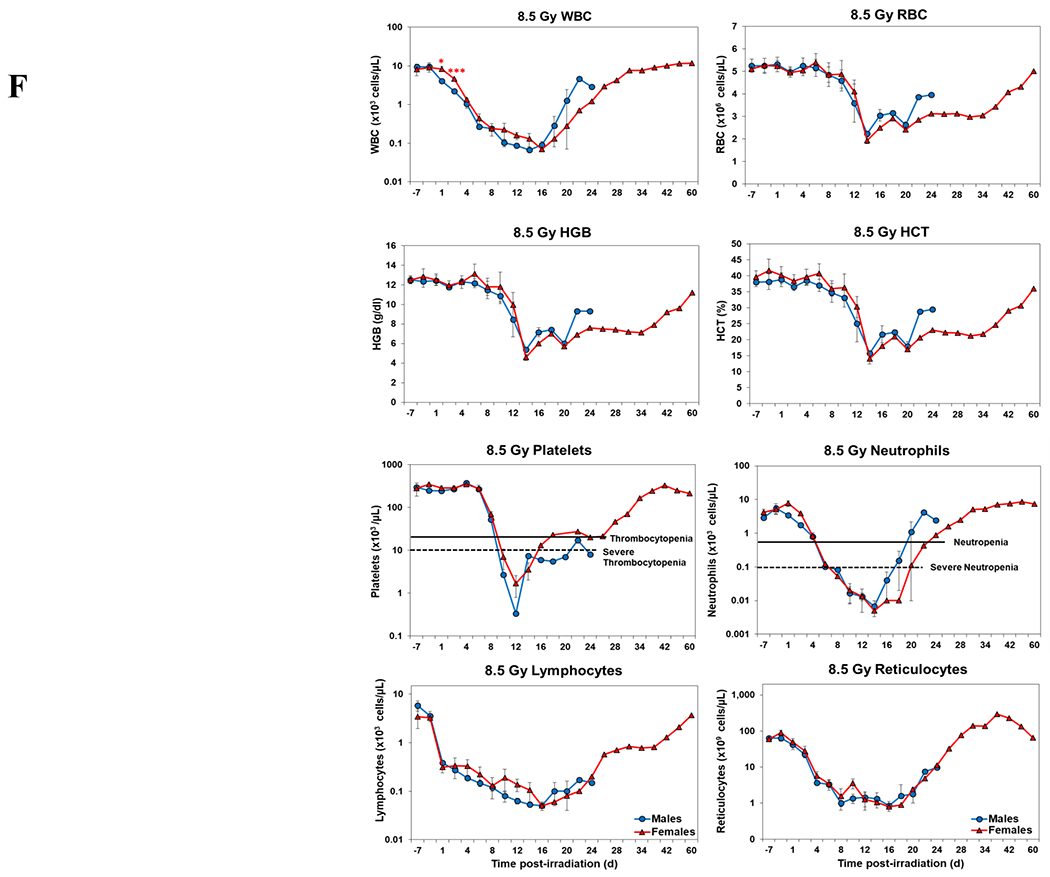
Complete blood counts of acutely irradiated NHPs provided clinical support. The data for each time point is presented as the mean for each group. Red asterisks indicate a significantly higher difference in females, while blue asterisks denote a significantly higher difference in males. The number of asterisks corresponds to the level of statistical significance as follows: *p<0.05, ***p<0.001. A. CBC responses of animals exposed at 6.0 Gy (6 total animals, with 2 males and 4 females). B. CBC responses of animals exposed at 6.5 Gy (6 total animals, with 3 males and 3 females). C. CBC responses of animals exposed at 7.0 Gy (6 total animals, with 1 male and 5 females). D. Represents responses of animals exposed at 7.5 Gy (6 total animals, with 5 males and 1 female). E. CBC responses of animals exposed at 8.0 Gy (6 total animals, with 5 males and 1 female). F. Represents responses of animals exposed at 8.5 Gy (6 total animals, with 3 males and 3 females).
