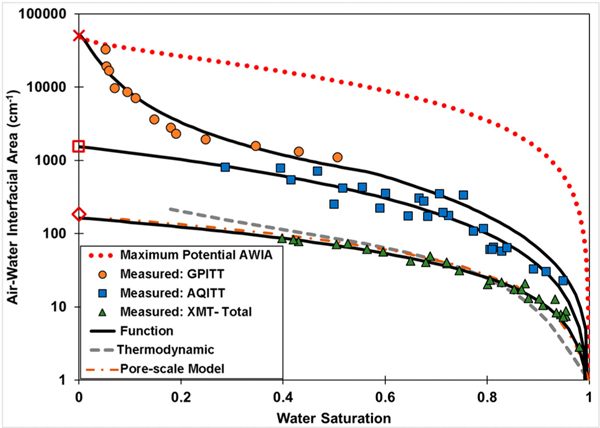
Fig. 1.
Measured and predicted air-water interfacial areas obtained with different methods for Vinton soil. Also included is the absolute-maximum interfacial area (red dotted curve) as described in the text. The large red diamond, square, and cross on the y-axis represent the geometric (smooth-surface) solid-surface area (GSSA), the AQITT-related maximum interfacial area (), and the NBET specific solid surface area (NBSSA), respectively. AWIA is air-water interfacial area; GPITT represents the gas-phase interfacial tracer-test method; AQITT represents various aqueous interfacial tracer-test methods; XMT represents the x-ray microtomography method. The measured data sources are presented in Section 2 of the SI.

