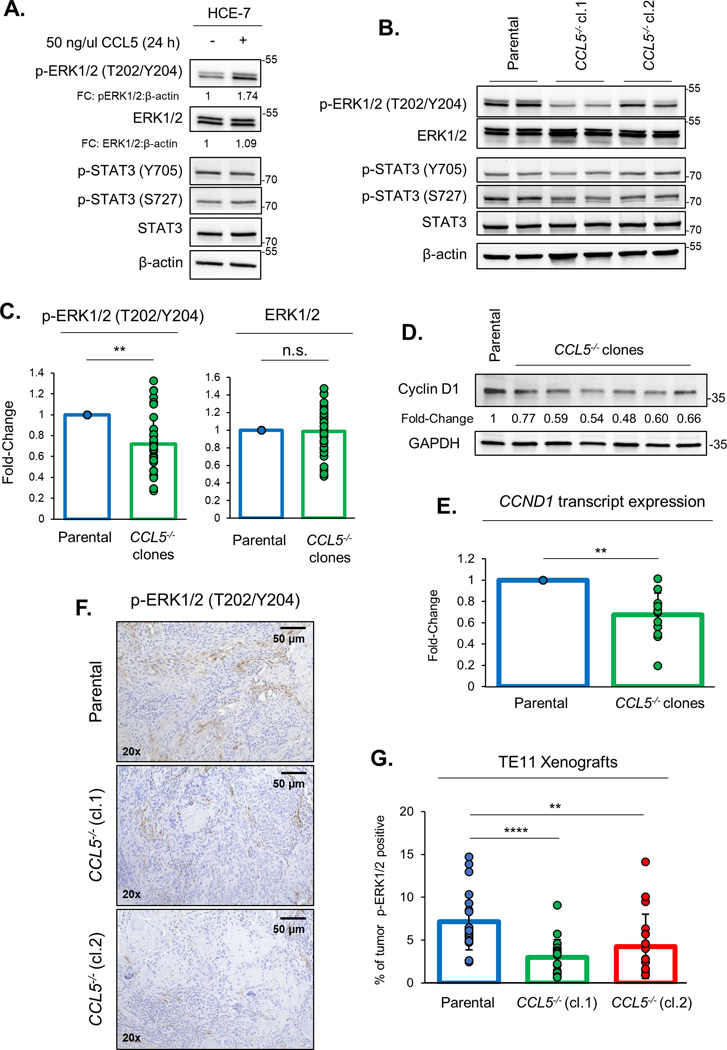
Fig. 3: Loss of tumor-derived CCL5 reduces ERK1/2 signaling.
(A) Immunoblotting of HCE-7 cells treated with 50 ng/μl CCL5 for 24 hours. Quantification of phosphorylated ERK1/2 (T202/Y204) and ERK1/2 protein levels were normalized to β-actin and displayed as fold-change (FC) below corresponding blot. (B) Immunoblotting of HCE-7 parental, HCE-7 CCL5−/− (cl.1) and HCE-7 CCL5−/− (cl.2) cell lines in duplicate. (C) Quantification of phosphorylated ERK1/2 (T202/Y204) and ERK1/2 protein levels were normalized to β-actin and displayed as fold-change as a bar graph with overlay of individual experiments. Results from all HCE-7 CCL5−/− clones were combined and compared to HCE-7 parental cells. (D) Immunoblotting of HCE-7 parental and CCL5−/− clones. Quantification of cyclin D1 protein levels were normalized to GAPDH and displayed as fold-change below corresponding blot. All immunoblotting is representative of a minimum of three biological replicates. (E) CCND1 mRNA transcript levels were quantified by qRT-PCR and normalized to house-keeping gene, GAPDH. Transcript levels are displayed as fold-change compared to HCE-7 parental cells. (F) Representative images of Xenografts generated from TE-11, TE-11 CCL5−/− (cl.1) and TE-11 CCL5−/− (cl.2) cell lines and stained with p-ERK1/2 (T202/Y204) and counterstained with hematoxylin. (G) Quantification of p-ERK1/2 (T202/Y204) positivity illustrated as the percentage of tumor area expressing p-ERK1/2 (T202/Y204) (n=6 per cohort). Significance has been determined using the unpaired student’s t-test with p-value denoted by asterisk. *<0.05, **<0.01, ***<0.001, ****<0.0001.

