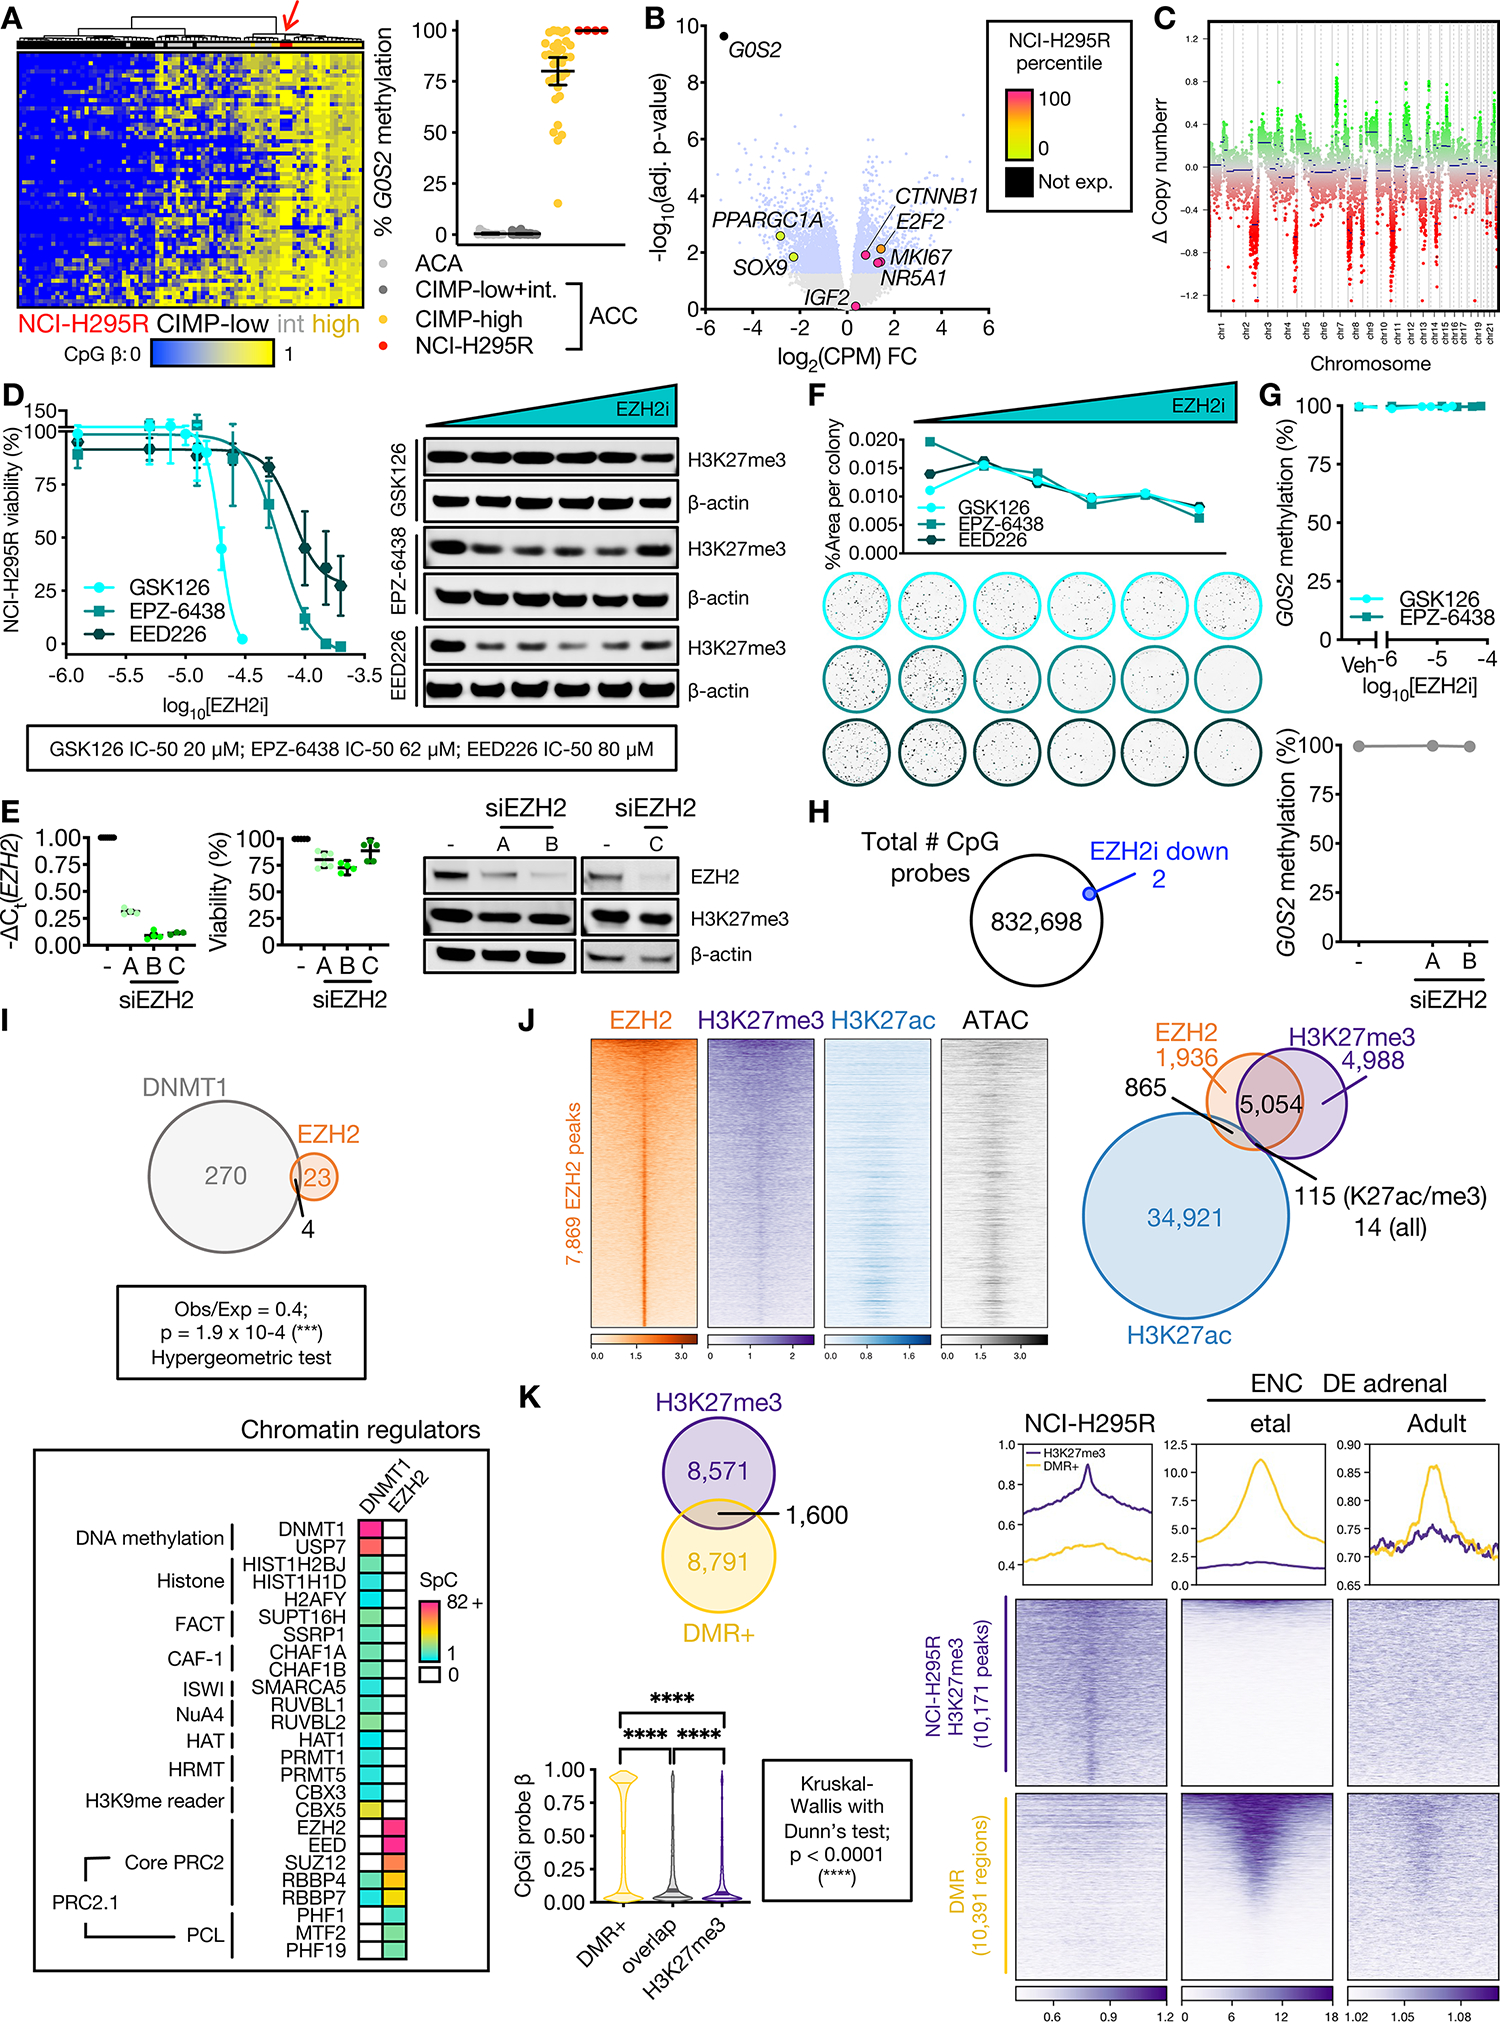
Figure 2: DNA methylation is propagated independently of PRC2 in CIMP-high ACC.

A. Left, heatmap of methylation at probes (rows) that define ACC-TCGA CIMP groups. Columns are ACC-TCGA samples classified by CIMP or baseline NCI-H295R cell line (red arrow, n=3, Illumina 850k array). Unsupervised hierarchical clustering with ward.D2 algorithm, Euclidean distance. Right, targeted assessment of G0S2 methylation in ACA (n=14), ACC stratified by CIMP-status (n=49 non-CIMP-high, n=33 CIMP-high), and baseline NCI-H295R, n=4; line at mean with 95% CI. ACA+ACC data from (8).
B. Volcano plot on RNA-seq data from CIMP-high vs. non CIMP-high ACC from ACC-TCGA. Light blue dots correspond to differentially expressed genes (adj. p-value=Benjamini-Hochberg-corrected p-value<0.05). Named genes are color-coded by NCI-H295R gene expression percentile (calculated from baseline RNA-seq). IGF2 is overexpressed in 90% of ACC, not differentially expressed across CIMP classes.
C. Total CpG signal across NCI-H295R baseline methylome was summed to predict DNA content, chromosomal segments and copy number, demonstrating “noisy” chromosomal signature characteristic of CIMP-high. In euploidy, Δ Copy number = 0.
D. Left, viability curves for NCI-H295R treated with different classes of EZH2i for 96 hours (EPZ-6438, GSK126 are SAM-competitive EZH2i, EED226 is an allosteric EZH2i; n=4 each), x-axis is log10 of the drug concentration in M. Data shown as mean with SEM. Right, western blot measuring H3K27me3 relative to β-actin loading control shown right, n>3; doses tested, GSK126: 0 (Vehicle), 1.25 μM, 5 μM, 7.5 μM, 15 μM, 20 μM (IC-50); EPZ-6438: 0, 1.25 μM, 12.5 μM, 25 μM, 50 μM, 62 μM (IC-50); EED226: 0, 1.25 μM, 12.5 μM, 25 μM, 50 μM, 80 μM (IC-50). Across replicates and all EZH2i, H3K27me3 levels measured by western blot (corrected by loading control and normalized to vehicle) are negatively linearly correlated with EZH2i concentration (Pearson test; p < 0.0001, r = −0.5117).
E. NCI-H295R transfected with EZH2 siRNA (siEZH2 A, B, or C) or scrambled negative control (–), and harvested at 144 hours to assess viability (line at mean with 95% CI) and EZH2/H3K27me3/β-actin by western blot (right, n≥2). NCI-H295R doubling time is ~60 hours; time points selected adequate to measure replication dilution of H3K27me3.
F. NCI-H295R were pre-treated with different classes of EZH2i for 96 hours as in D (right), and viable cells were plated at colony forming density in regular (EZH2i-free) medium, grown for 4 weeks. Top, colony area (quantified with Fiji) vs. EZH2i pre-treatment doses. Bottom, representative images of crystal-violet stained colonies at increasing EZH2i doses. Representative experiment shown, n=2.
G. G0S2 methylation after increasing doses of EZH2i (n=3, top) or EZH2 siRNA (n=1, bottom). Data represented as mean with SEM for each condition. Veh=Vehicle.
H. Venn diagram of total number of CpG probes in NCI-H295R methylome and those which were differentially methylated following EZH2i (EPZ-6438 at the IC-50 dose). No probes gained methylation after EZH2i.
I. Top, Venn diagram of unique proteins retrieved by DNMT1 IP-MS and EZH2 IP-MS on NCI-H295R nuclear lysates. Bottom, peptides retrieved from DNMT1 or EZH2 IP-MS mapping to known chromatin regulators. SpC=spectral counts.
J. Left, heatmap of EZH2, H3K27me3, and H3K27ac ChIP-seq and accessibility (ATAC=ATAC-seq) signal in baseline NCI-H295R at EZH2 peaks, ranked by EZH2 signal. Centered at peak +/− 3 kb window. Right, Venn diagram of EZH2, H3K27me3, and H3K27ac peaks.
K. Top, Venn diagram of baseline NCI-H295R H3K27me3 peaks and regions targeted for hypermethylation in CIMP-high ACC (DMR+). Bottom, violin plot of average CpG island methylation level (β) in DMR+, DMR+/H3K27me3 overlap regions, and H3K27me3 peaks; lines at median and quartiles.
L. Profile plot and heatmap of H3K27me3 signal at regions annotated as baseline NCI-H295R H3K27me3 peaks and DMR+ in NCI-H295R and ENCODE fetal and adult adrenal ChIP-seq. Centered at peak/DMR +/− 3 kb window.
