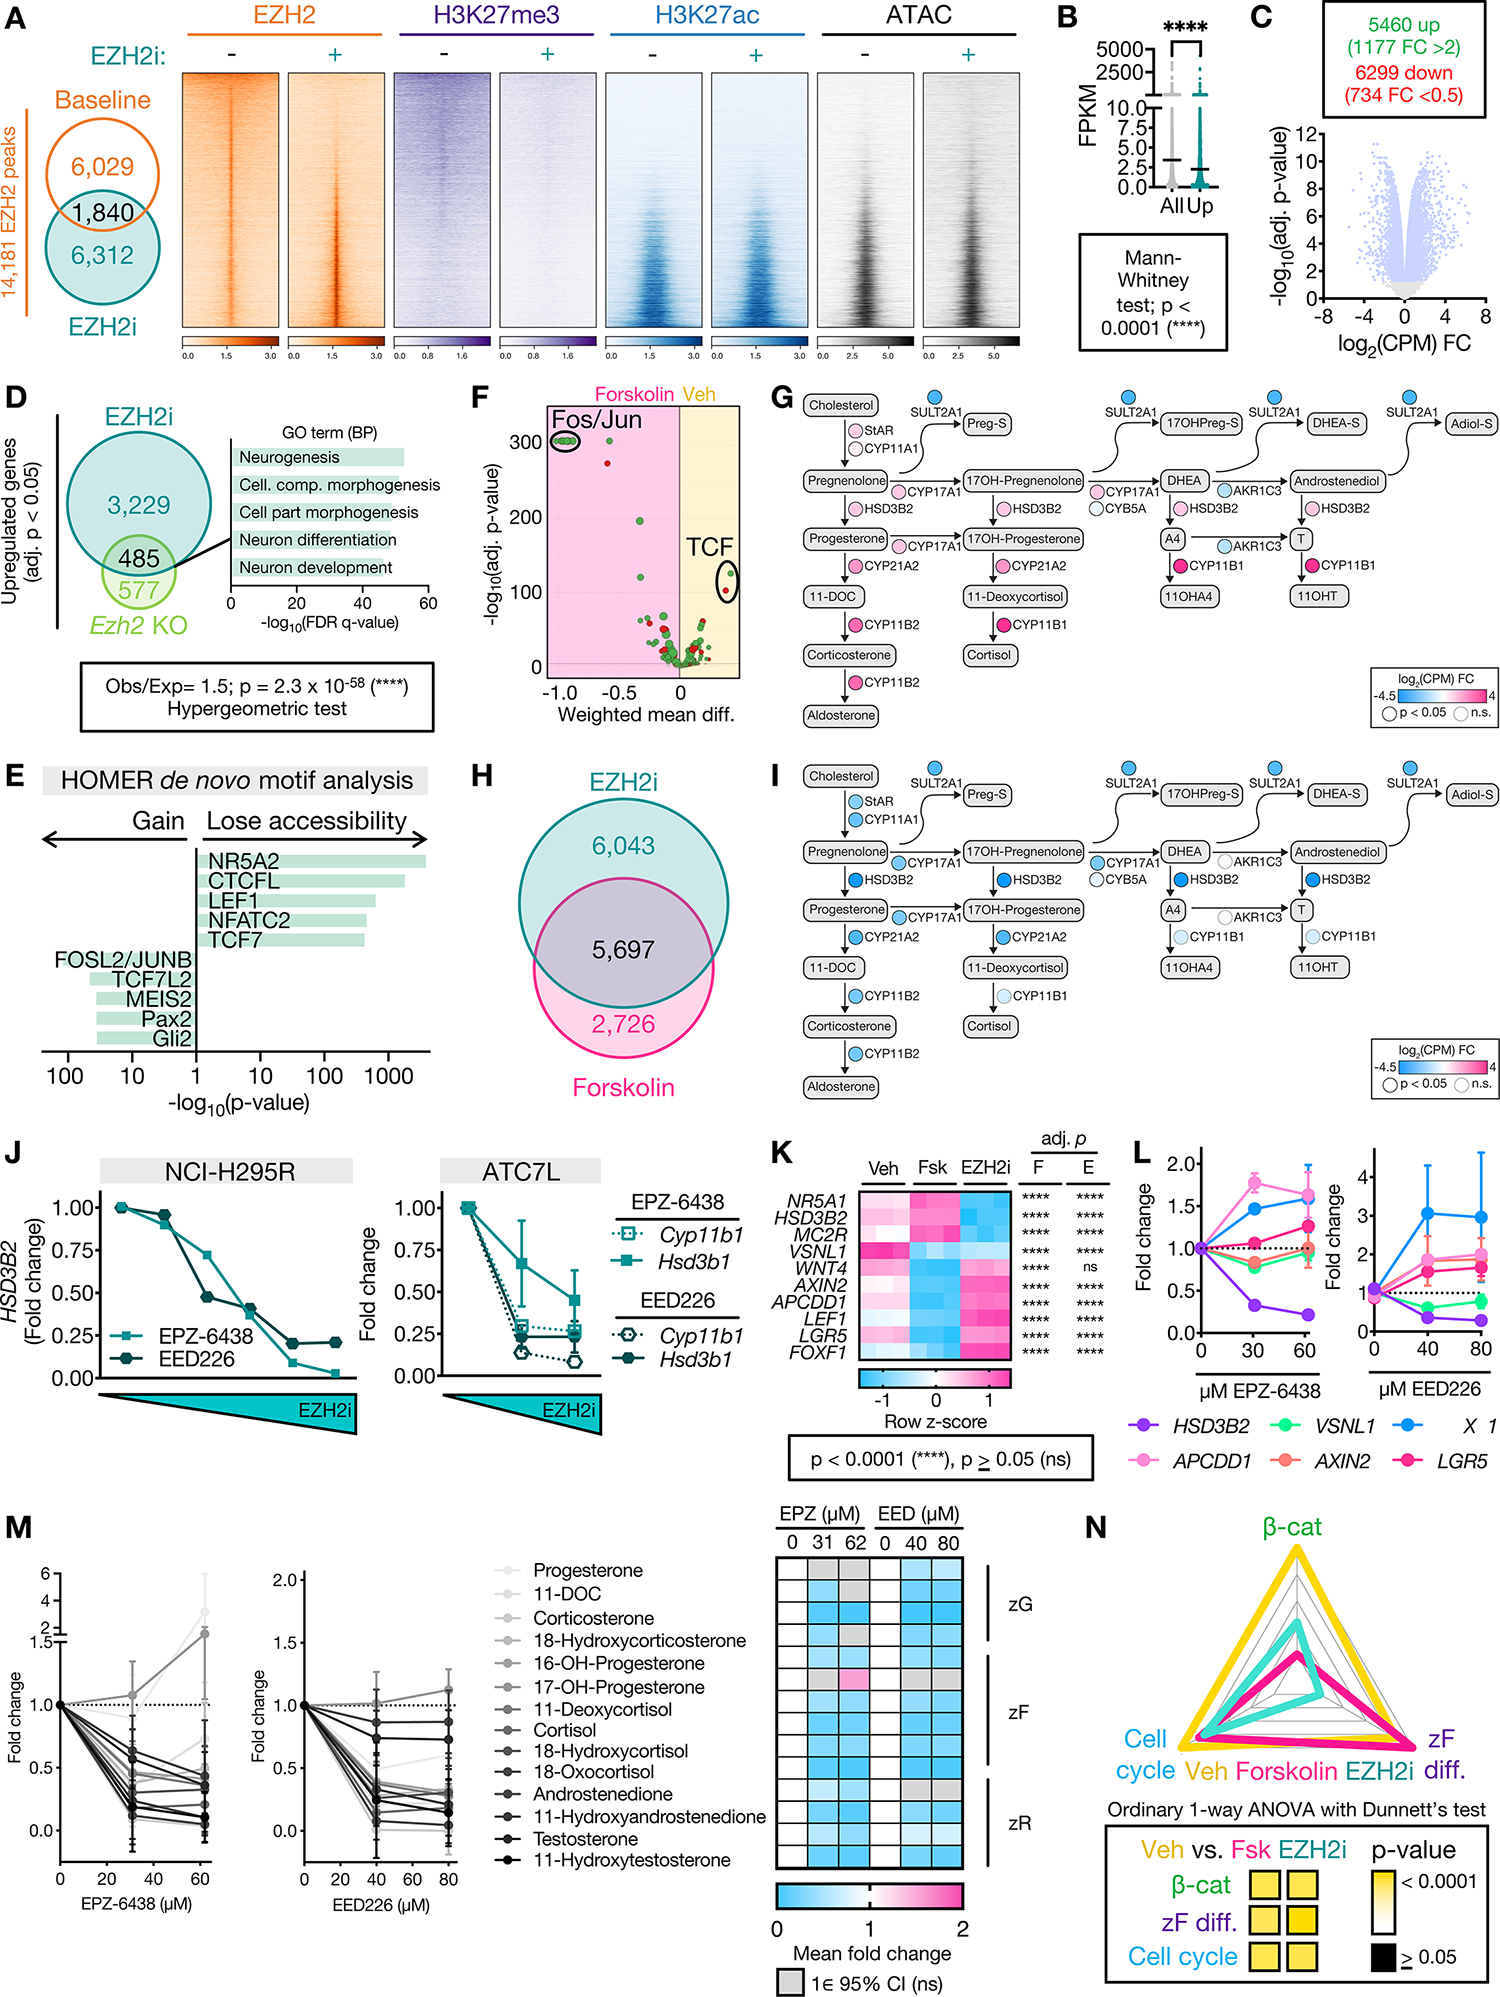
Figure 3: EZH2i disrupts EZH2 recruitment genome-wide, restrains zF differentiation, and reverses the CIMP-high molecular state.

A. Left, Venn diagram of NCI-H295R EZH2 peaks at baseline (vehicle-treated, EZH2i−) and after EZH2i (EZH2i+=EPZ-6438 at the IC-50 dose). Right, heatmap of EZH2, H3K27me3, H3K27ac signal in union set of EZH2 peaks at baseline and after EZH2i. Heatmap ranked by ratio of EZH2 signal at baseline to after EZH2i. Centered at peak +/− 3 kb window.
B. Average baseline NCI-H295R expression (fragments per kilobase of transcript per million mapped reads, FPKM) of all genes in the transcriptome compared to baseline FPKM of genes induced by EZH2i (Up).
C. Top, number of differentially expressed genes (adj. p-value<0.05) in EZH2i- vs. vehicle-treated NCI-H295R, FC=fold change. Bottom, corresponding volcano plot. Light blue dots correspond to differentially expressed genes.
D. Left, Venn diagram of genes upregulated by EZH2i in NCI-H295R with genes upregulated in mouse model of SF1-driven Ezh2 deficiency (Ezh2 KO, (52)). Right, 5 most significant gene sets resulting from GSEA on overlap genes using the GO (BP=Biological Processes) gene set.
E. HOMER motif analysis on differentially accessible peaks from NCI-H295R EZH2i compared to baseline ATAC-seq. NR5A2 shares same motif as NR5A1 (SF1).
F. DiffTF integrating RNA-seq and ATAC-seq from NCI-H295R treated with forskolin to induce zF differentiation vs. vehicle. Negative and positive weighted mean difference reflect transcription factor signal stronger in forskolin- or vehicle-treated cells, respectively.
G. Steroidogenesis diagram depicting impact of forskolin on expression of zonally expressed steroidogenic enzymes in NCI-H295R by RNA-seq.
H. Venn diagram of differentially expressed genes (compared to baseline) in NCI-H295R treated with EZH2i or forskolin by RNA-seq (Supp Table 1).
I. Steroidogenesis diagram depicting impact of EZH2i on enzyme expression in NCI-H295R by RNA-seq.
J. Fold change in expression of steroidogenic enzymes in ACC cell lines treated with increasing doses of EZH2i measured by qPCR. NCI-H295R, n=1. ATC7L, n=2–3 for all points. Data shown as mean with SEM. Concentrations tested were: NCI-H295R, as in Figure 2D; ATC7L - 0, 42 μM, 84 μM EPZ-6438 (IC-50) and 0, 53 μM, 107 μM EED226 (IC-50).
K. Heatmap of gene expression of NCI-H295R at baseline (vehicle, Veh), following forskolin (Fsk) treatment or following EZH2i with adj. p-value for comparison to Veh shown right, by RNA-seq. FOXF1 is a PRC2 target (Supp Fig 4B). Per Supp Fig 3B, “zF genes”= HSD3B2, MC2R and remainder are “zG genes”.
L. NCI-H295R were treated with indicated doses of EZH2i followed by forskolin. Gene expression measured by qPCR, n=3. Data shown as mean with SEM.
M. LC-MS/MS analysis of media from NCI-H295R treated as in L to measure zone-specific steroid output. Left, line graph depicting fold change of normalized steroid output relative to vehicle. Data shown as mean and 95% CI. Right, heatmap displaying mean fold change. If the null value (1) falls in the 95% CI of the mean for each treatment group, change in steroid output is considered insignificant (ns) and fold change is not displayed.
N. ZF differentiation, Wnt, and cell cycle scores for NCI-H295R at baseline (Veh) or treated with forskolin (Fsk) or EZH2i, calculated and graphed as in Figure 1B.
