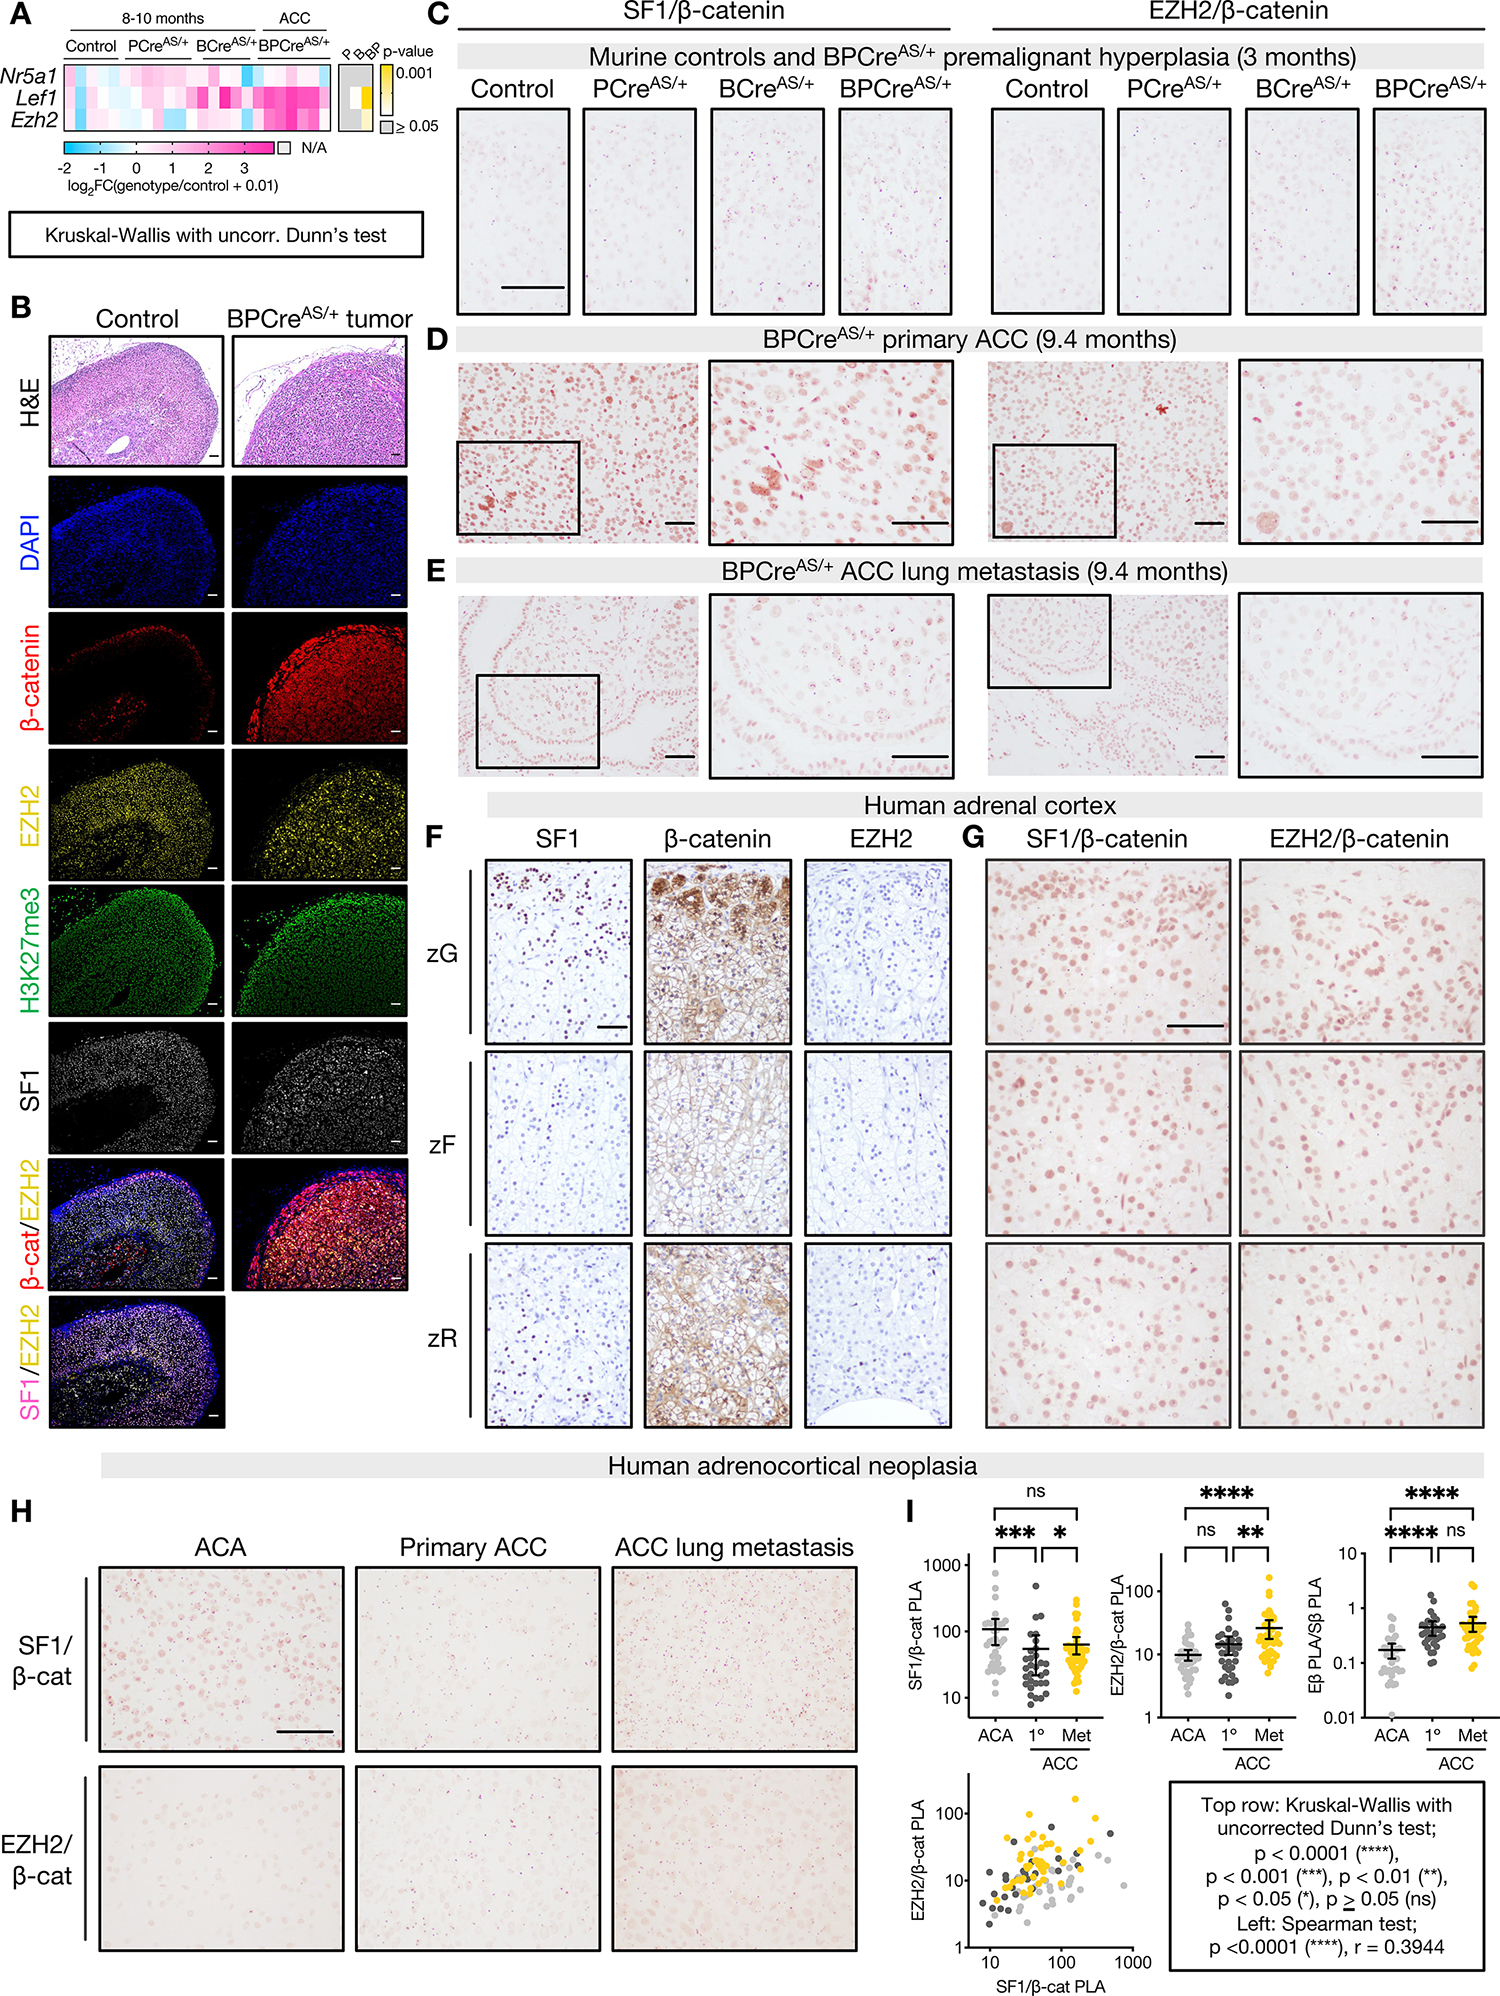
Figure 5: Nuclear EZH2/β-catenin and SF1/β-catenin complexes persist through adrenocortical neoplastic evolution.

A. Left, heatmap of gene expression measured by qPCR in adrenals from control mice (ASCre/+), mice with p53 LOF (PCreAS/+), mice with β-catenin GOF (BCreAS/+), or ACC from combined p53 LOF/β-catenin GOF (BPCreAS/+). Right, p-value for each genotype compared to control.
B. Top row, representative hematoxylin and eosin (H&E) staining of control adult mouse adrenal and BPCreAS/+ primary tumor (10-month-old). Rows 2–6, immunofluorescence staining nuclei (DAPI), β-catenin, EZH2, H3K27me3, or SF1. Rows 7–8, colocalization of β-catenin or SF1 and EZH2. Bar=50 μm.
C-E. Representative images of SF1/β-catenin (left) and EZH2/β-catenin (right) proximity ligation assay (PLA) performed on 3-month-old adrenals (control, n=4; PCreAS/+, n=3; BCreAS/+, n=3; BPCreAS/+, n=4), BPCreAS/+ primary ACC (n=5), BPCreAS/+ lung metastases (n=3). PLA signal are subnuclear pink dots. Bar=100 μm.
F-G. Representative images of SF1, β-catenin, and EZH2 IHC or SF1/β-catenin and EZH2/β-catenin PLA in human adult adrenal cortex (n=2). Bar=100 μm.
H. Representative images of SF1/β-catenin and EZH2/β-catenin PLA in a TMA of human adult ACA (n=39) and primary (n=34) and metastatic (n=35) ACC.
I. Normalized TMA PLA signal, quantified by Fiji. Each sample is represented by a point. Top right, “Eβ PLA/Sβ PLA” refers to ratio of EZH2/β-catenin PLA signal to SF1/β-catenin PLA signal. Top row, line at mean with 95% CI.
