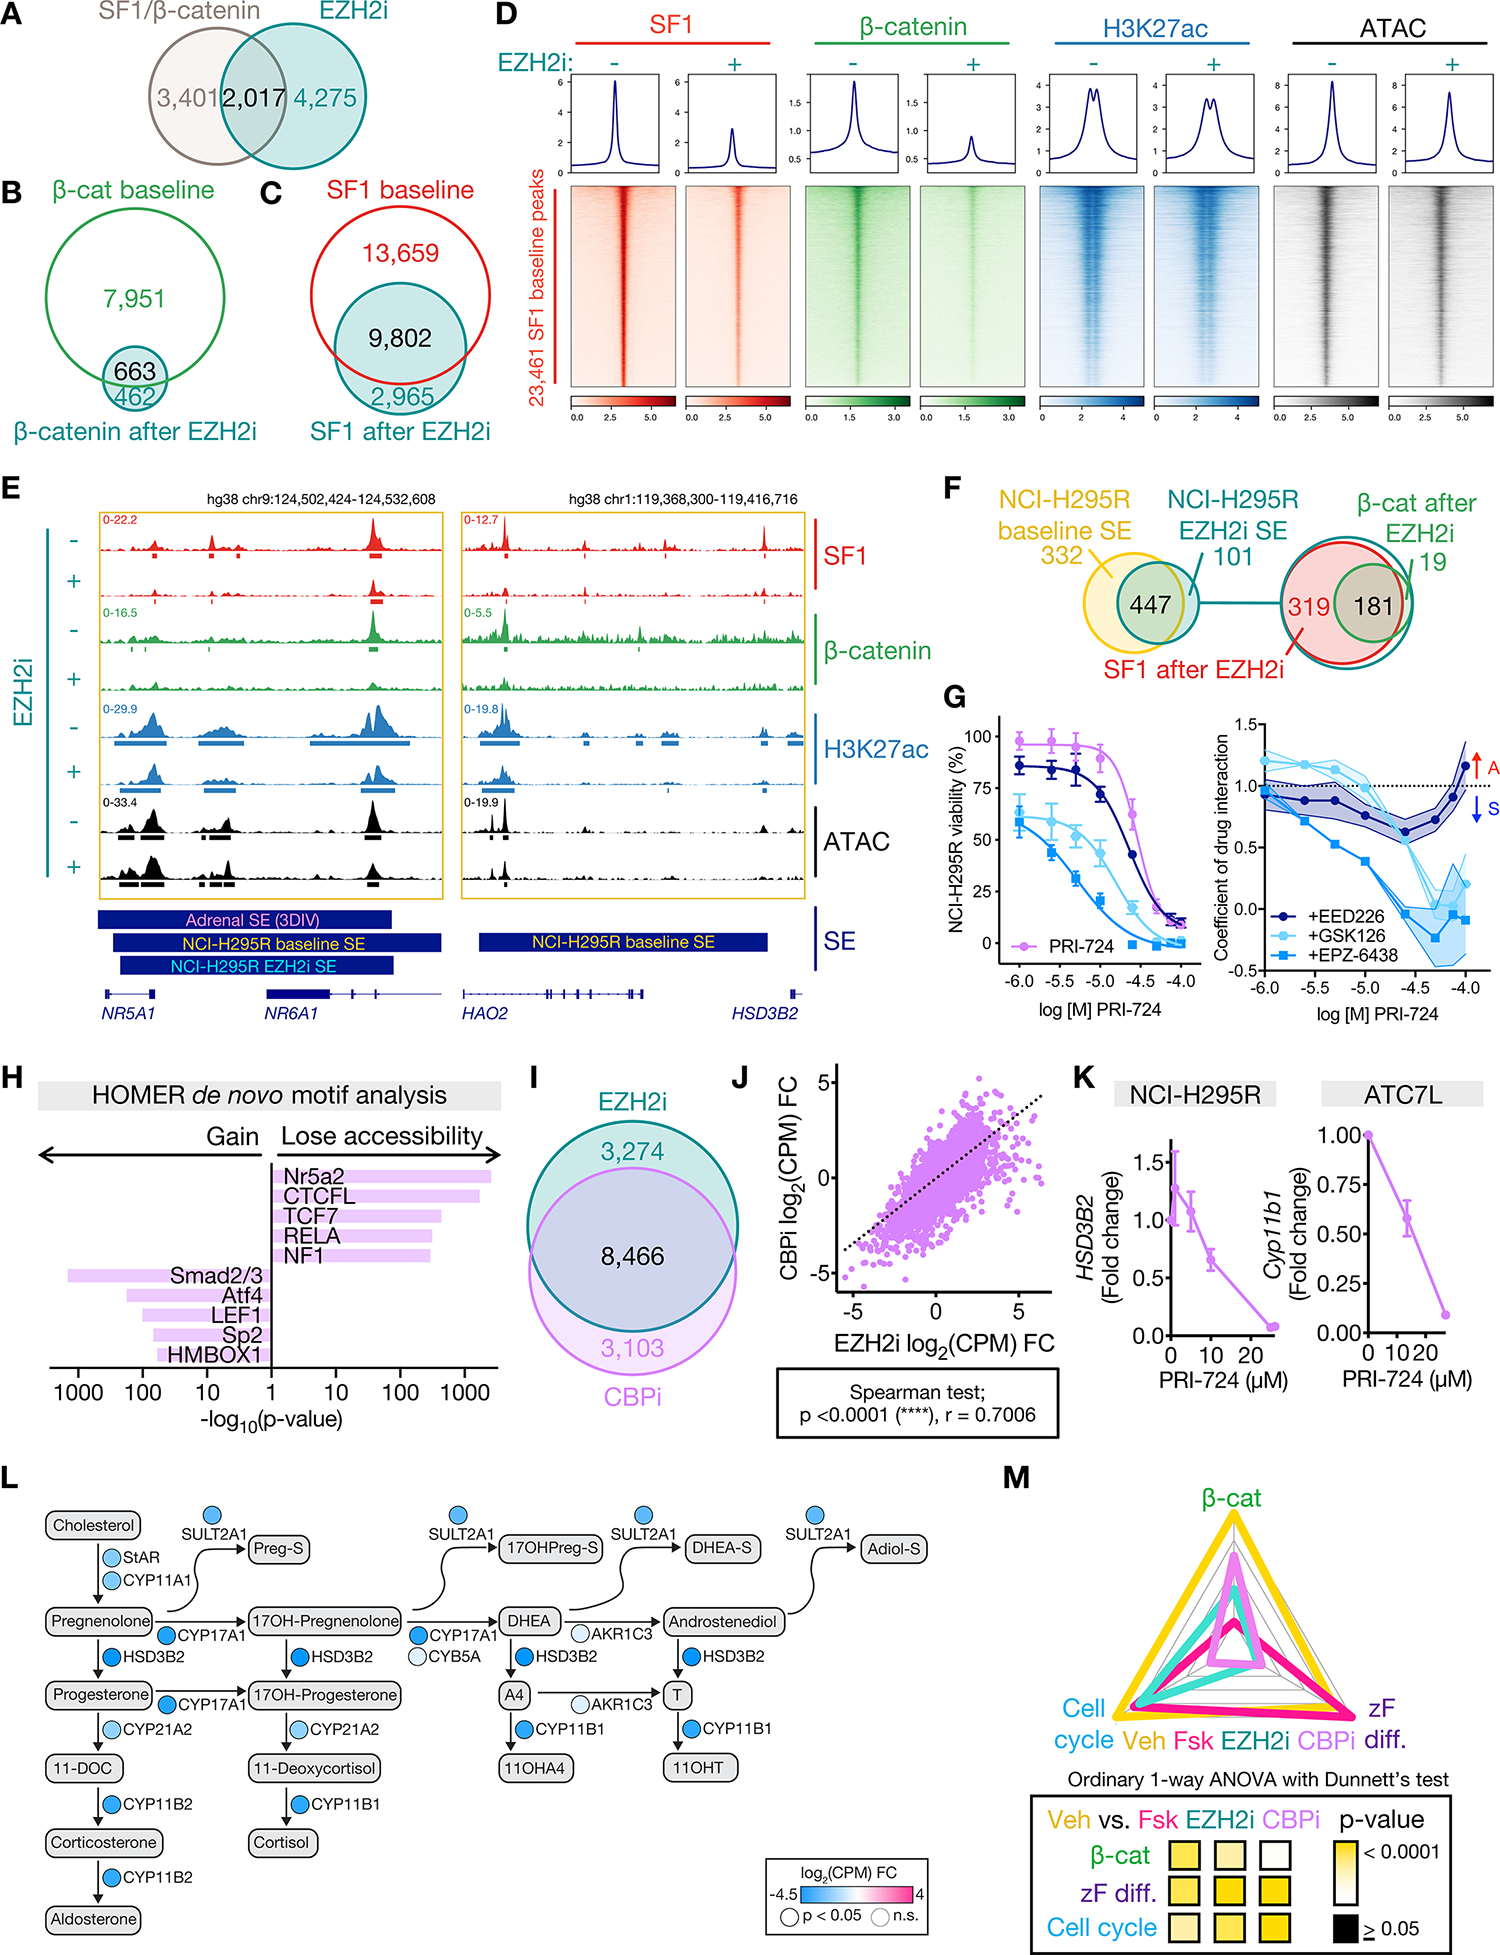
Figure 6: EZH2i evicts SF1 and β-catenin genome-wide, disrupting enhancer programming in CIMP-high ACC.

A. Venn diagram of genes putatively regulated by active SF1/β-catenin-bound enhancers and downregulated by EZH2i.
B-C. Venn diagram of NCI-H295R β-catenin or SF1 peaks at baseline (vehicle-treated) and after EZH2i.
D. Profile plot and heatmap of NCI-H295R SF1, β-catenin, H3K27ac, and ATAC signal at SF1 peaks at baseline (EZH2i−) and after EZH2i (EZH2i+), ranked by baseline SF1 signal. Centered at peak +/− 3 kb window.
E. Example SF1, β-catenin, H3K27ac ChIP-seq, and accessibility (ATAC-seq) tracks across the NR5A1 and HSD3B2 loci in NCI-H295R at baseline (as in Figure 4M) or after EZH2i. Peak calls depicted by bars below each track. 3DIV annotation of adrenal SE, NCI-H295R baseline and EZH2i SE shown by bars below window.
F. Left, Venn diagram of NCI-H295R SE at baseline and after EZH2i. Right, Venn diagram of NCI-H295R EZH2i SE with SF1 EZH2i peaks and β-catenin EZH2i peaks.
G. Left, viability curves for NCI-H295R treated with increasing concentrations of CBP inhibitor (CBPi) PRI-724 +/− different EZH2i (GSK126, EPZ-6438 or EED226) at the IC-50 dose. Right, coefficient of drug interaction (CDI) for viability. CDI>1 represents antagonism (A), CDI <1 represents synergy (S). Data are represented by mean with SEM (whiskers or error bands). CBPi, n=9; CBPi + GSK126, n=3; CBPi + EPZ-6438, n=3; CBPi + EED226, n=3.
H. HOMER motif analysis on differentially accessible peaks from NCI-H295R CBPi (IC-50) compared to baseline ATAC-seq.
I. Venn diagram of differentially expressed genes (compared to baseline) in NCI-H295R treated with EZH2i or CBPi (IC-50) measured by RNA-seq (Supp Table 1).
J. Scatterplot of change in gene expression (compared to baseline) in NCI-H295R treated with CBPi vs. EZH2i.
K. Fold change in expression of steroidogenic enzymes in ACC cell lines treated with increasing doses of CBPi measured by qPCR. NCI-H295R, n=2. ATC7L, n=3. Data shown as mean with SEM.
L. Steroidogenesis diagram depicting impact of CBPi on enzyme expression in NCI-H295R by RNA-seq.
M. ZF differentiation, Wnt, and cell cycle scores for NCI-H295R at baseline (Veh) or treated with forskolin (Fsk), EZH2i, or CBPi calculated and graphed as in Figure 3N.
