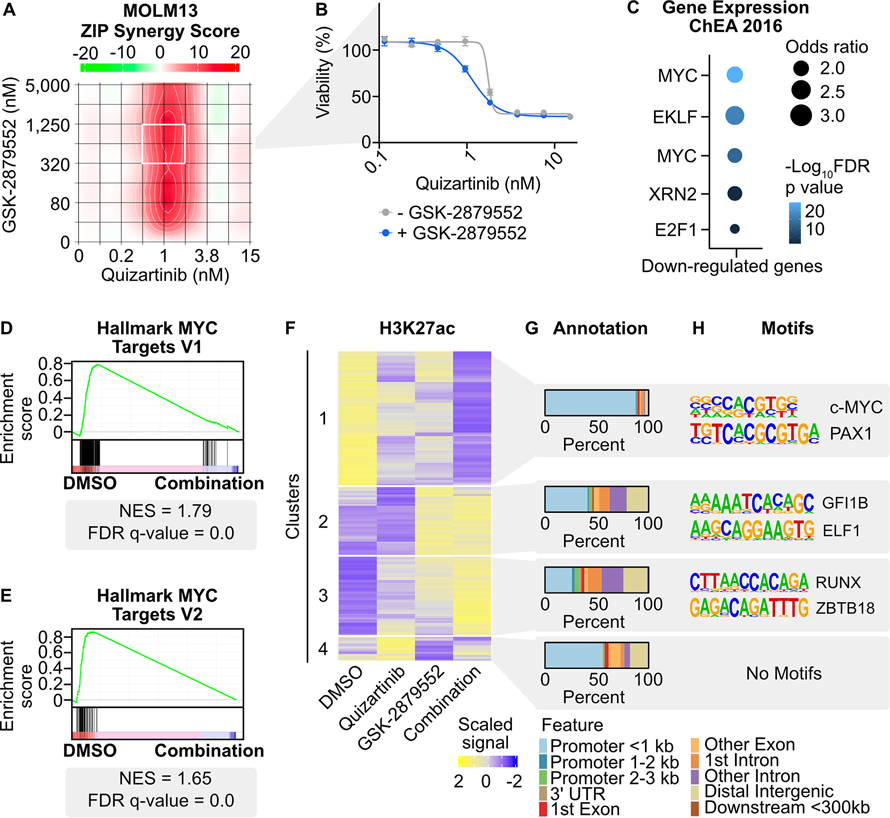
Fig. 1: Transcriptional and chromatin dynamics in response to combined FLT3/LSD1 inhibition in FLT3-ITD-positive AML.
A, MOLM13 cells were treated in triplicate with an 8×8 dose matrix of quizartinib and GSK-2879552 for 72 hours prior to viability assessment by CellTiter Aqueous colorimetric assay. Zero interaction potency (ZIP) synergy scores were calculated on the average values for each drug dose. The white box indicates the quizartinib and GSK-2879552 concentrations corresponding to maximal synergy. B, Quizartinib response curves with and without GSK-2879552 (638 nM, which is the concentration corresponding to maximal synergy in (A)). The GSK-2879552 response curve with and without quizartinib is shown in Supplementary Fig. 1. C, MOLM13 cells were treated with quizartinib (1 nM), GSK-2879552 (100 nM), the combination, or an equal volume of DMSO vehicle for 24 hours prior to RNA sequencing. Analysis was performed on genes with decreased expression with the drug combination relative to DMSO. D, E, GSEA was performed comparing the drug combination to DMSO. F, MOLM13 cells were treated with quizartinib (1 nM), GSK-2879552 (100 nM), the combination, or an equal volume of DMSO vehicle for 2 hours prior to CUT&Tag for H3K27ac. Unsupervised hierarchical clustering of regions with differential signal following drug treatment. G, Annotation of regions in clusters from (F). H, Motif enrichment of regions with differential H3K27ac signal. Top two de novo motifs with p-value <10−12 are shown.

