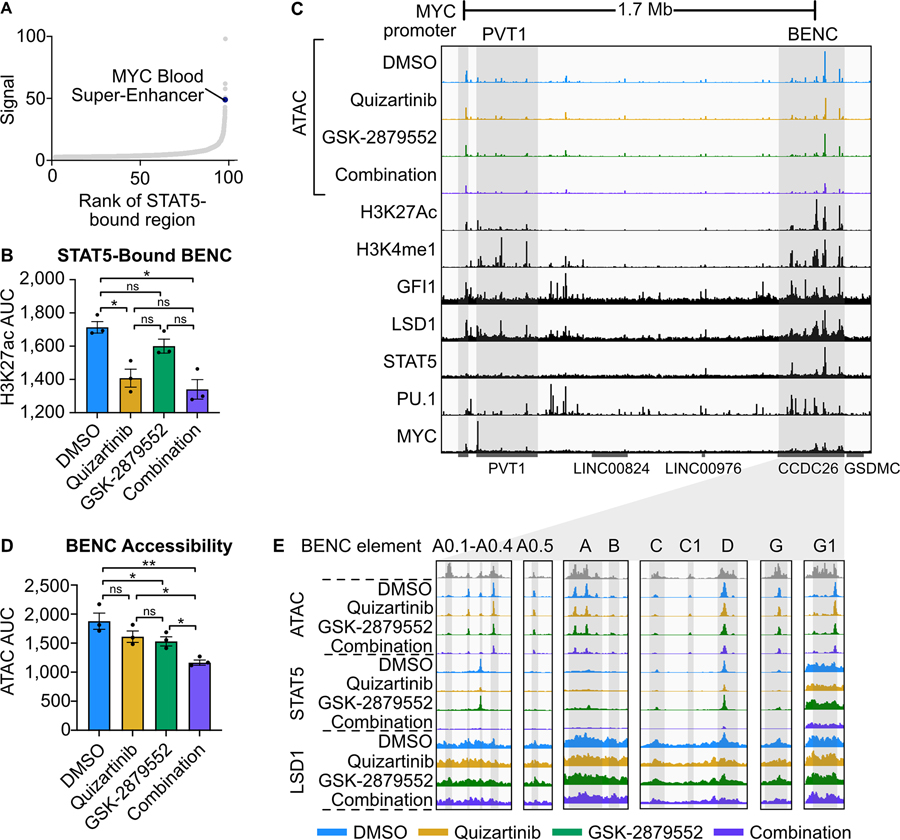
Fig. 4: FLT3-Inhibition represses MYC expression through a loss of STAT5 binding to the MYC blood super-enhancer cluster.
A, STAT5-bound regions from Fig. 2 ranked by ChIP-seq signal. B, H3K27ac CUT&Tag signal AUC at STAT5-bound BENC elements. H3K27ac signal data is from MOLM13 cells in Fig. 1 whereas the STAT5 signal data is from MOLM13 cells in Fig. 2. Statistical significance was determined by two-way ANOVA with a Holm-Šidák post-test correction. C, ATAC-seq was performed on MOLM13 cells quizartinib (1 nM), GSK-2879552 (100 nM), the combination, or an equal volume of DMSO for 24 hours. Representative histone modification and transcription factor tracks (from DMSO conditions in Fig. 2) shown at the extended MYC locus. D, ATAC signal AUC at all MYC BENC modules. Statistical significance was determined by two-way ANOVA with a Holm-Šidák post-test correction. E, ATAC, STAT5 ChIP-seq, and LSD1 ChIP-seq signal at twelve BENC modules. ns = not significant, * = p < 0.05, ** = p < 0.01, *** = p < 0.001, **** = p < 0.0001.

