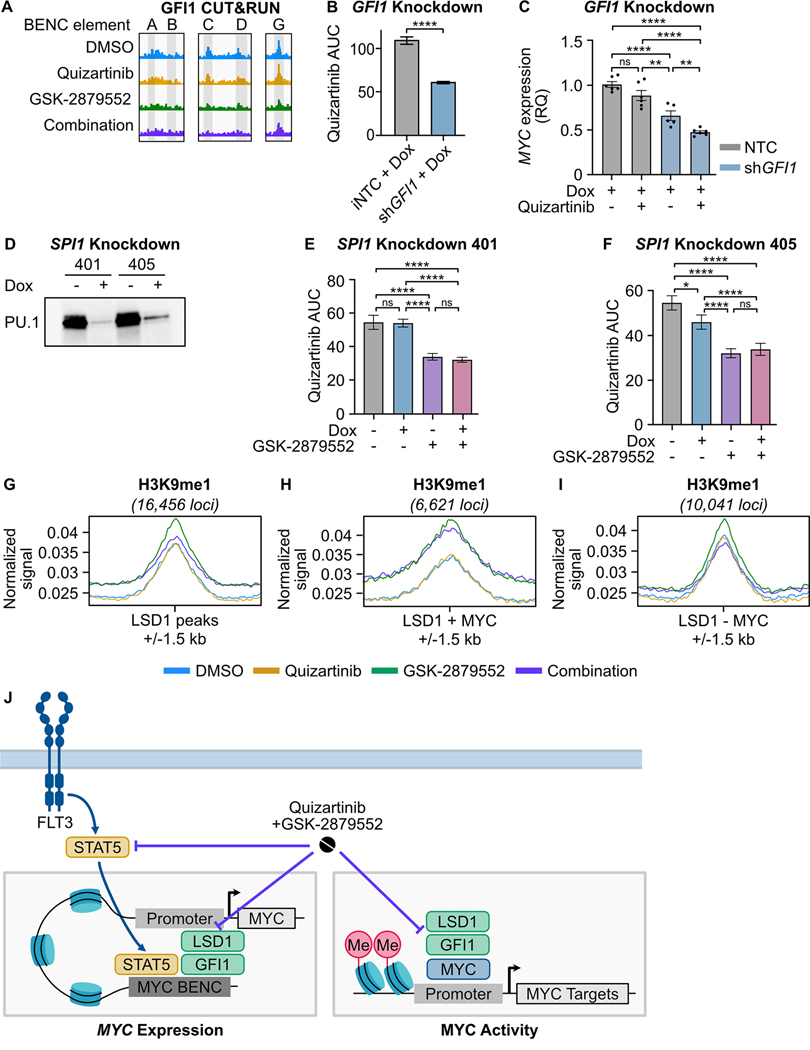
Fig. 5: LSD1 inhibition disrupts GFI1 binding at the MYC BENC and induces a gain of H3K9me1 binding at MYC-bound promoters.
A, GFI1 CUT&RUN signal from Fig. 2 at five BENC modules. B, MOLM13 cells were transduced with lentiviral particles harboring a doxycycline-inducible non-targeting codon (NTC) or GFI1 shRNA knockdown vector. Quizartinib AUC of cells treated with doxycycline (1 μg/mL) or DMSO for 72 hours. Substantial knockdown was observed in the absence of doxycycline treatment, so only doxycycline-treated samples were compared. The quizartinib response curves are shown in Supplementary Fig. 7. Statistical significance was determined by Student’s t-test. C, qPCR assessment of gene expression in cells treated with doxycycline (1 μg/mL) for 48 hours prior to the addition of quizartinib (1 nM) for 24 hours. Expression was normalized to GUSB as an endogenous control. Statistical significance was determined by two-way ANOVA with a Holm-Šidák post-test correction. D, MOLM13 cells were transduced with lentiviral particles harboring a doxycycline-inducible SPI1 shRNA knockdown vector. Western blot for PU.1, which is encoded by SPI1, in cells treated with doxycycline (1 μg/ml) or an equivalent volume of DMSO for 48 hours. E, F, Cells were treated with doxycycline (1 μg/mL) or DMSO for 48 hours and then plated in an 8×8 matrix of quizartinib and GSK-2879552 for 72 hours prior to viability assessment. AUC data from the 311 nM GSK-2979552 isoline (the concentration corresponding to maximal synergy in the SPI1 knockdown MOLM13 cells) is shown. Dose responses and synergy over the entire drug matrix is shown in Supplementary Fig. 9. Statistical significance was determined by two-way ANOVA with a Holm-Šidák post-test correction. G-I, MOLM13 cells were treated with quizartinib (1 nM), GSK-2879552 (100 nM), or the combination for 6 hours prior to CUT&Tag for H3K9me1. Normalized signal for H3K9me1 at LSD1-bound regions, LSD1 and MYC co-bound regions, and at regions bound by LSD1 but not MYC. J, Schematic describing the drug combination mechanism. ns = not significant, * = p < 0.05, ** = p < 0.01, *** = p < 0.001, **** = p < 0.0001.

