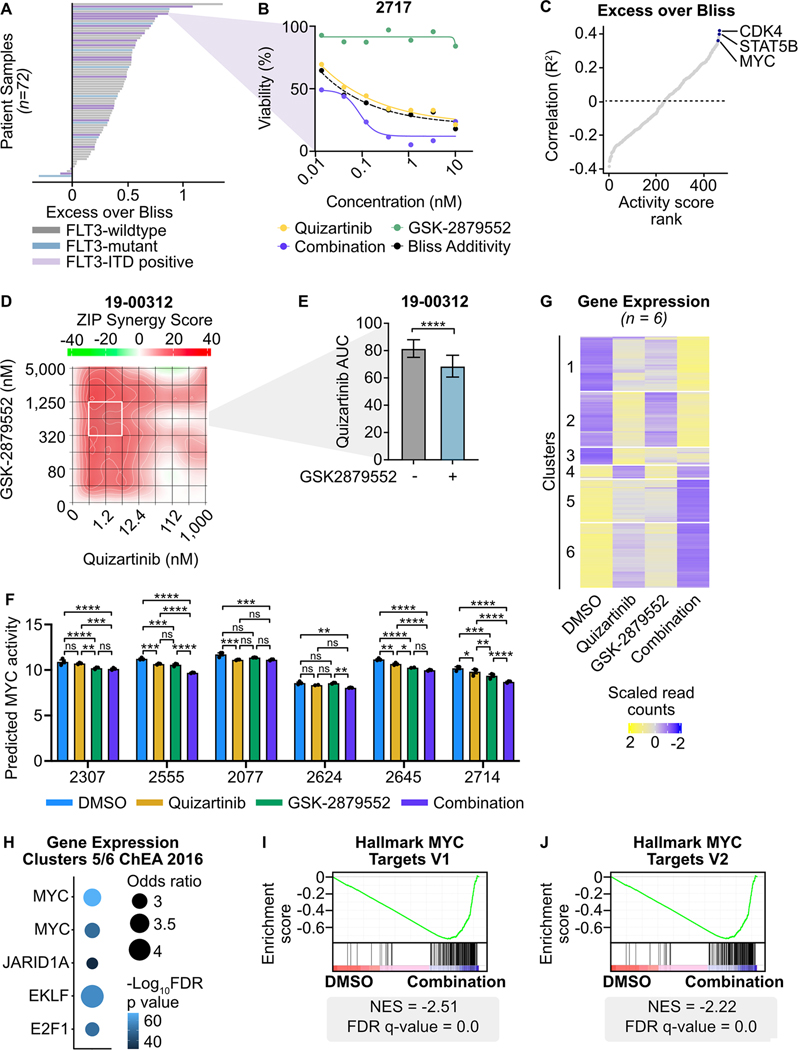
Fig. 6: Combined FLT3/LSD1 inhibition drives synergistic cell death by repressing a MYC-dependent transcriptional network in primary AML blasts.
A, Primary AML blasts from 72 total samples (18 FLT3-ITD-positive) were cultured for 72 hours along a 7-point curve with either quizartinib, GSK-2879552, or equimolar amounts of the drug combination. Cell viability was assessed by CellTiter Aqueous colorimetric assay. Excess over Bliss was calculated using cell viability at corresponding drug concentrations. Each bar represents the mean excess over Bliss across all concentrations. Bar color indicates FLT3 mutation status. B, Dose response curves for quizartinib, GSK-2879552, and the drug combination in a FLT3-ITD-positive AML sample from (A). C, Spearman’s correlation of excess over Bliss and predicted transcription factor activity. Transcription factors were ranked by goodness of fit (R2). D, Primary blasts from a FLT3-ITD-positive AML sample were treated in triplicate with an 8×8 dose matrix of quizartinib and GSK-2879552 for 72 hours prior to viability assessment by CellTiter Aqueous colorimetric assay. ZIP synergy scores were calculated on the average values for each drug dose. E, AUC data from the 628 nM GSK-2979552 isoline (the concentration corresponding to maximal synergy in (D)) is shown. Statistical significance was determined by Student’s t-test. F, Bulk RNA-seq was performed on six FLT3-ITD-positive patient samples treated in triplicate with 500 nM quizartinib, 500 nM GSK-2879552, both drugs in combination, or an equivalent volume of DMSO for 24 hours. MYC transcription factor activity was inferred from RNA-seq. Statistical significance was determined by two-way ANOVA with a Holm-Šidák post-test correction. G, Unsupervised hierarchical clustering of differentially expressed genes following drug treatment. H, Transcription factor target enrichment from clusters in (G). I, J, GSEA was performed comparing the drug combination to DMSO. ns = not significant, * = p < 0.05, ** = p < 0.01, *** = p < 0.001, **** = p < 0.0001.

