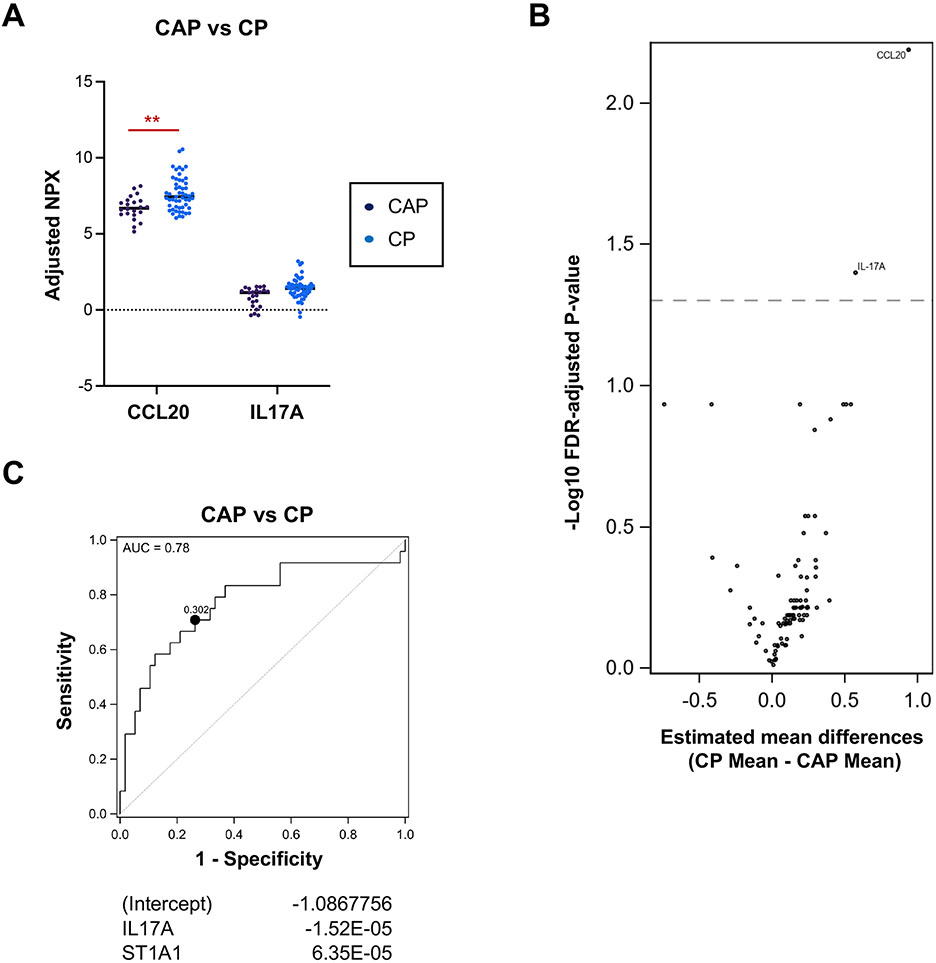
Figure 3. Th17 responses discern CP from the chronic abdominal pain (CAP) group.
A. Protein levels of differentially expressed serum immune markers in CAP (n=24) vs. CP (n=57). Data are adjusted for the covariates of age, sex, smoking, and drinking status. FDR-adjusted p-values of all markers displayed are less than 0.05, **p<0.01. B. Volcano plot of differentially expressed immune markers in CAP vs. CP. C. Receiver Operator Characteristic (ROC) curve for CP versus CAP with IL17A and ST1A1 (optimistic AUC: 0.78, Optimal cutpoint: 0.302). Shown are regression coefficient estimates from the elastic net. A positive coefficient indicates a positive association with CAP.

