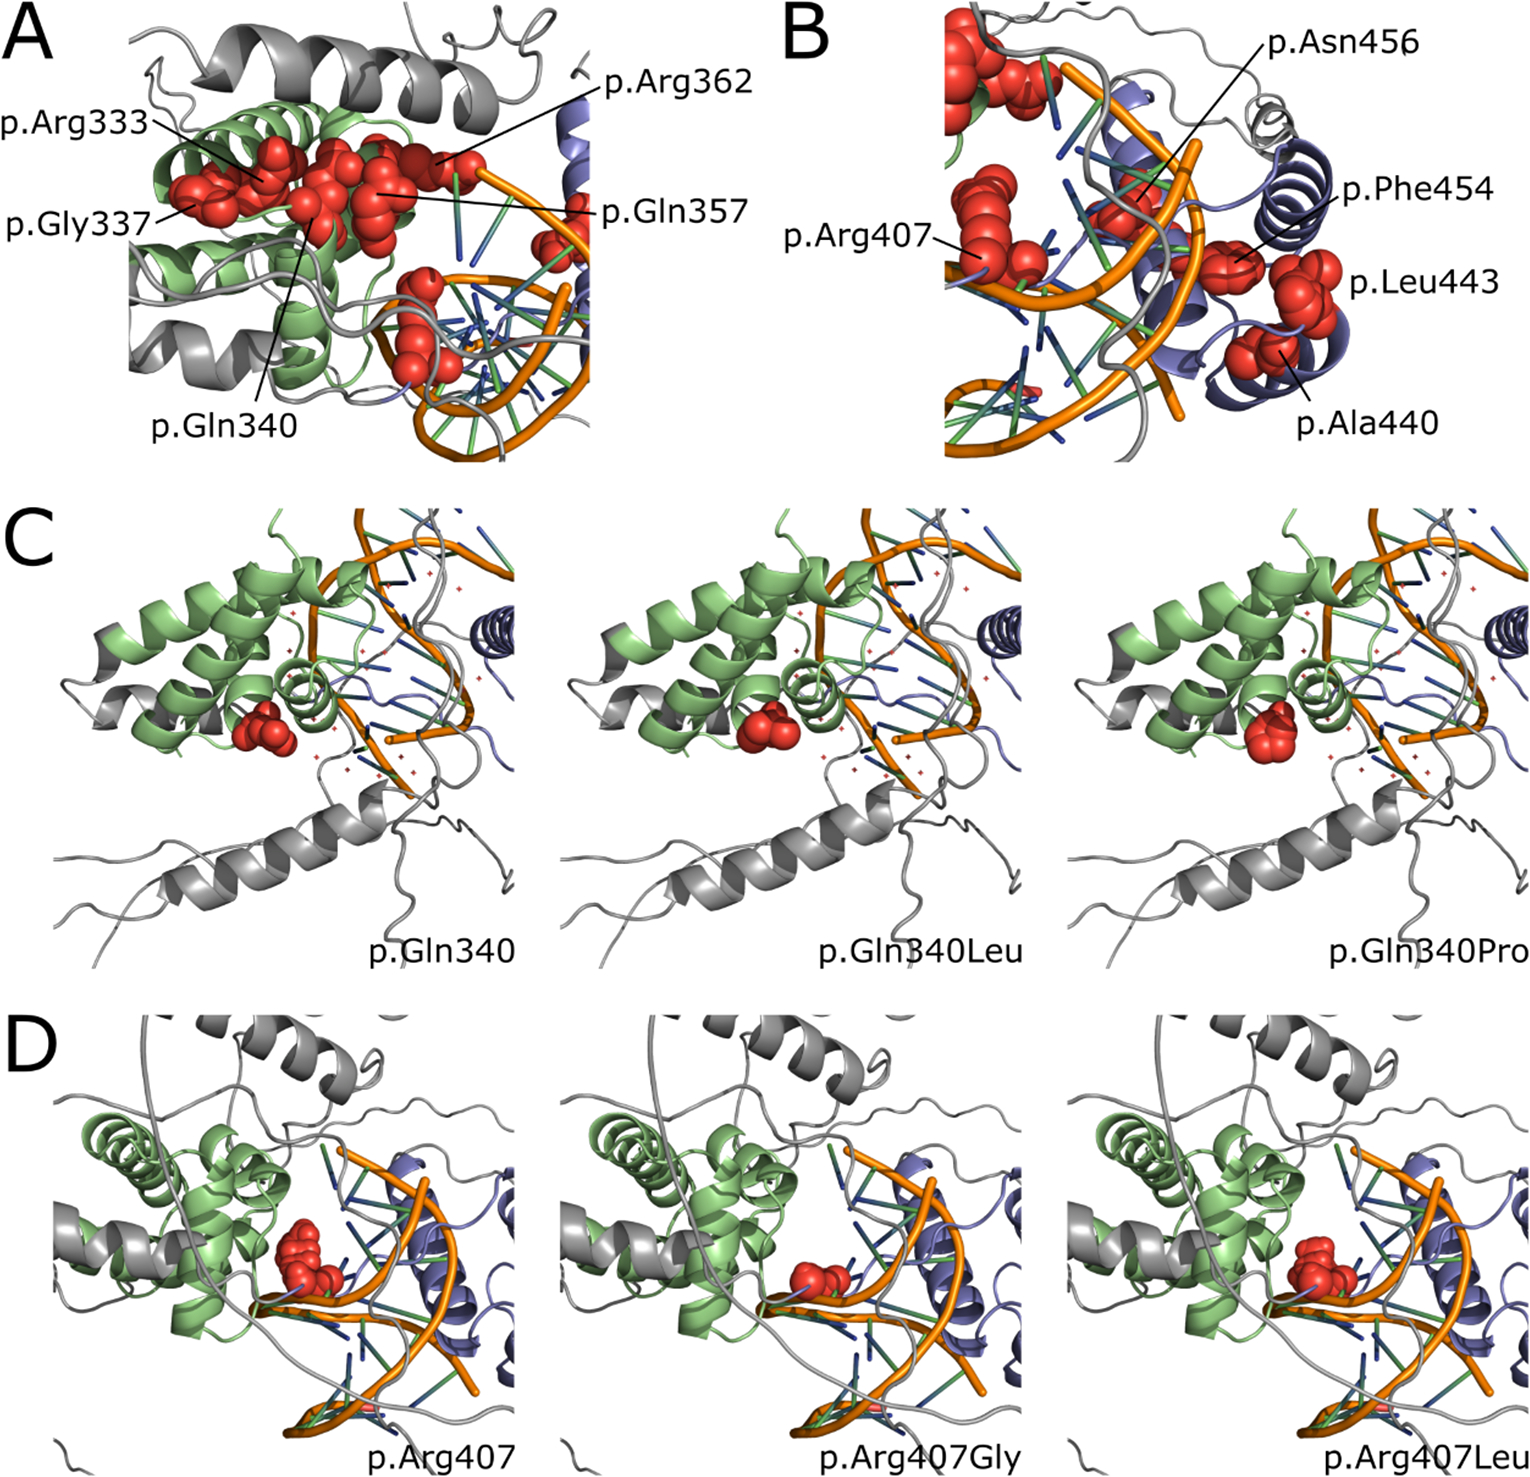
Figure 4A-B; C-D.

A-B. Representative three dimensional overview of the two POU3F3 domains with amino acid positions (highlighted as spheres in red) affected by disease-associated missense variants within the cohort and literature (based on AlphaFold structure aligned with DNA molecule). Panel A represents the POU-S domain in green and panel B the POU-H domain in blue with the DNA molecule in orange in the middle. The rest of the POU3F3 protein is colored in grey.
C-D. Two chosen examples of amino acid changes at positions 340 (C) and 407 (D). Left panels show unchanged amino acid structure, while each of the right panels show structural consequences of respective amino acid change.
