
Figure 2. Volcano plots showing dysregulated urinary metabolites at day 1 (Panel A), day 14 (Panel B), 1 month (Panel C) and 3-months (Panel D) post-irradiation.
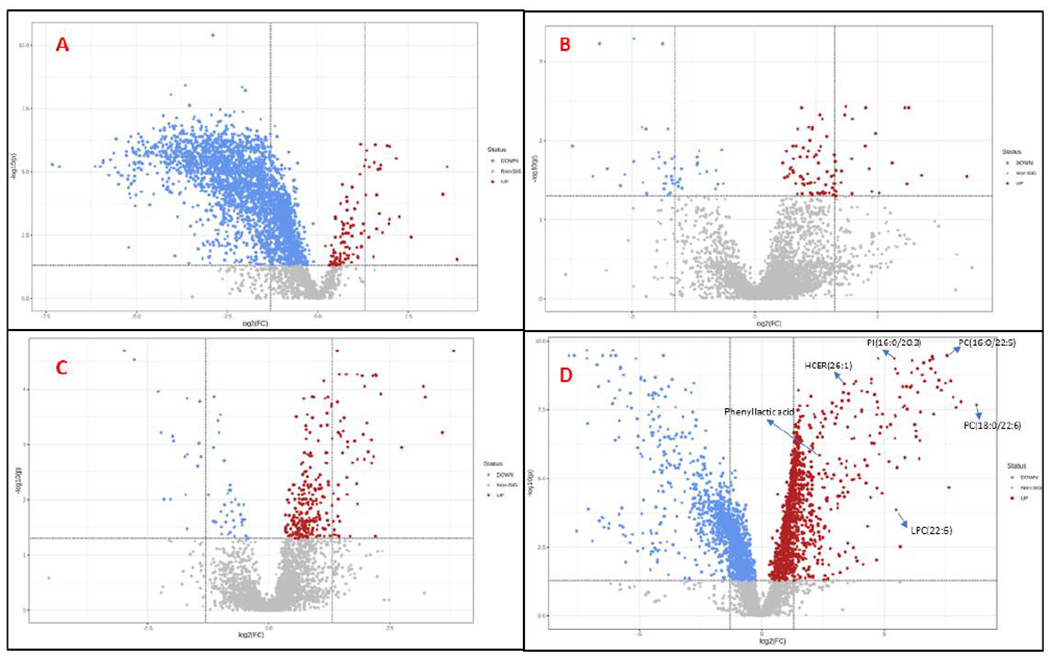
Each dot represents a putative metabolite; statistically significant changes comparing sham vs irradiated groups include adjusted p-value (<0.05) on the X-axis and fold change of ≤ 2 on the Y-axis. Gray: indicates no significant change in metabolite abundance, Red: Statistically significant upregulation, Blue: Red: Statistically significant downregulation